Category Archives: Dynamics CRM

Downloading Salesforce Or Dynamics CRM Data To SQL Server (For Free)

Summary
As my background is in SQL Server databases I find it a lot easier to query data in SQL. The process in this post will show you how to carry out a manually run download of data from multiple objects in Salesforce or Dynamics CRM – using trial versions of KingswaySoft Tools in SSIS (SQL Server Integration Services).

I’ll be connecting to a trial Salesforce instance and downloading Contacts to SQL Server. Whenever I say Salesforce it can be interchanged with Dynamics CRM – the KingswaySoft CRM Components only slightly differ in how the objects and fields are selected.

I’ll assume that you have no prior knowledge of Visual Studio or SSIS, although you will need know how to connect to and run queries against a SQL database.

Requirements
You’ll need:
* A Salesforce or Dynamics CRM instance (this can be a trial)
* A Windows PC/Server with SSIS installed.
* A SQL Server instance (this can be hosted on a VM, or directly in Azure) with an empty database.

I’ll be using a VM running Windows 10 with the below items installed:
* SQL Server 2012 SP4
* Visual Studio 2015 Update 3
* SQL Server Data Tools for Visual Studio 2015
These are the versions I had had installed on my VM – newer versions of Visual Studio and SQL Server Data Tools should run fine, though I haven’t tested these.

Install KingswaySoft SSIS Integration Toolkit
We’ll install a trial version of this to allow us to connect to Salesforce. The only limitation that the trial version has is that you can only run it in the development environment. This means that the solution will not work if we deploy the SSIS package to a server – this will require a license.

Download links
SSIS Integration Toolkit for Salesforce –
https://www.kingswaysoft.com/products/ssis-integration-toolkit-for-salesforce/download
SSIS Integration Toolkit for Microsoft Dynamics 365 –
https://www.kingswaysoft.com/products/ssis-integration-toolkit-for-microsoft-dynamics-365/download
On the download form KingswaySoft requires a corporate/business email.

If you haven’t got such an email you can use a temporary email from https://10minutemail.com/

Installation
Once you have the installation files just install the toolkit taking the default options.


Create A Visual Studio Project
In Visual Studio create a new project of type ‘Integration Service Project’

If this options isn’t available ensure that SSIS and SQL Server Data Tools are installed correctly.

Add and Configure Connection Managers
We will make two connections here – one to Salesforce, and the second to SQL Server.

Connection to Salesforce
Right-click on the “Connection Managers” area on the bottom of the screen and select “New Connection…”

In the next dialog select the “Connection Manager for Salesforce” then click “Add”

You will now need to choose the Instance Type, and enter your (Salesforce) User Name & Password, and Security Token.
The Security Token is used to ensure that if someone has your Salesforce account details they can’t connect to the Salesforce data connector without it.
If you know your Security Token then enter it, otherwise request a new Token. This is the Salesforce Help Page for Security Tokens – https://help.salesforce.com/articleView?id=sf.user_security_token.htm&type=5
Click on “Test Connection” and you should see a message stating that the Test Connection Succeeded. If not, check the details you have entered.

Connection to SQL Server
Right-click on the “Connection Managers” area on the bottom of the screen and select “New OLE DB Connection…”

On the next dialog click “New” to make a new data connection, then enter the details for your SQL Server connection.
My connection is shown below, connecting to the local SQL Server (this is the dot in the Server Name) using SQL Server authentication and a database called “SFDB-Blog”
Click on “Test Connection” and you should see a message stating that the Test Connection Succeeded. If not, check the details you have entered.
Click on “OK” to close the Connection Manager dialog

You should now have 2 connections in the “Connection Managers”. Don’t worry about what they’re named – that’s not important.


CREATING THE SALESFORCE SOURCE COMPONENT
From the SSIS Toolbox drag a “Data Flow Task” to the package

Right-click on the Data Flow Task and rename it to “DFT – Download Contacts”
Double-click on “DFT – Download Contacts” to edit it. You will now be in the Data Flow edit screen:

From the SSIS Toolbox drag a “Salesforce Source” component to the Data Flow

Double-click the newly added “Salesforce Source”. Click on the Connection Manager dropdown and select the value Salesforce Connection Manager.
For the Source Object select the object you want to download. I will be downloading the Contact object.

Click on the “Columns” on the left and select the fields you want to download. As a general rule of thumb it’s better to download only the fields you want – but always download the Id column (the record unique identifier). You may want to click on the top check box to uncheck all fields initially.

Click the ‘OK’ button to close the dialog

CREATING THE SQL DESTINATION COMPONENT
From the SSIS Toolbox drag a “OLE DB Destination” component to the Data Flow. Rename the newly added “OLE DB Destination” to “OLEDB – Contacts”.
Click on “Salesforce Source” component, and then drag the connector arrow to the “OLEDB – Contacts” component. It should now look as below:

Double-click “OLEDB – Contacts” to open the edit dialog.
We will now use the component to generate the SQL to create the SQL Server table to hold the data. Click the “New button” and the SQL will be displayed:

Copy this SQL and paste it into a connection to your SQL Server – I’m using SSMS (SQL Server Management Studio). In the script change the text “OLEDB – Contacts” to the name you want to give to the SQL table – I’ll be using “Contacts”. Execute the query to create the SQL table.

Back in Visual Studio – Cancel the open script dialog, and in the main dialog on the table dropdown select your new table.

Click on the ‘Mappings” on the left to ensure that all columns are mapped correctly – it should look similar to below where all columns are connected from left to right:

Click “OK” to close the dialog.

FIRST RUN OF DOWNLOADING DATA
We are now ready to run and test the first table downloading data from Salesforce.
Click the “Start” button

After a few seconds (or minutes depending on the number of records in your Salesforce data object) it should complete successfully:

To ensure it has worked correctly view the data in your SQL table:

CLEAR DATA BEFORE RUN
When the routine runs we want to clear the existing SQL data otherwise it would append duplicate data to the SQL table.
To do this click on the “Control Flow”, and drag an “Execute SQL Task” component to the main pane, above the component “DFT – Download Contacts”:

Right-click on the newly added “Execute SQL Task” and rename it to “SQL – Truncate Contacts”
Double-click on ” SQL – Truncate Contacts” to edit it. For the “Connection” select the SQL connection, and in the “SQLStatement” enter as below (using your SQL table name):

Click OK to close the dialog, and as then connect the components by dragging the arrow from “Execute SQL Task” to “DFT – Download Contacts”
Click on the “Start” button to run the routine and once complete it should look as below.


ADDING MORE DOWNLOAD TABLES
You can repeat the above process to add additional tables. I’ve added the Account table – as shown below:

WRAP UP
I hope you found this post beneficial – Thanks for reading 🙂

Photo by Markus Spiske on Unsplash

Hosting an SSRS Report in a Dynamics CRM 365 Form

Introduction

So, as we all know, reports can be designed using Visual Studio or Report Builder and uploaded to the Reports section in CRM.  But, what if you want to display the report directly in a form?   This is what a client wanted to do as it would enable their users to view non CRM data in a CRM form.  In the past they had issues with browser security and had not gotten very far.


Testing the Report

To test this I utilized an Azure VM which had SQL Server 2014 including SSRS (SQL Server Reporting Service) installed onto it.  A SQL Table and a sample report were created, which looked as below:

2017-10-23_11h00_17

Next, a new CRM form was created and an IFRAME added to it with the URL (http://crm2015dev/Reports/Pages/Report.aspx?ItemPath=%2fTestSSRSReport%2fTestSSRSReport) of the above report.  The number of the rows for the IFRAME were set to 12, from the default of 6.

On opening of the CRM form 2 security prompts were displayed, and required accepting before the report would be shown.  These are the 2 prompts:
2017-10-20_12h12_06

2017-10-23_14h51_27


Removing the IE Security Prompts

A bit of searching online and in forums revealed the 2 Internet Explorer settings that needed to be changed to remove the prompts.  Both settings are in the same dialog.  To get to the dialog open the IE internet options dialog, then the Security Tab.
Select ‘Local intranet’, then click the button ‘Custom level…’

2017-10-23_11h19_20

Locate the option ‘Display mixed content’ and change it to ‘Enable’2017-10-23_11h20_54

Locate the option ‘Websites in less privileged web contents zone can navigate into this zone’ and change it to ‘Enable’

2017-10-23_11h23_47

After restarting IE the the CRM form now displays the SSRS report with no security prompts:

2017-10-23_11h28_21


Conclusion

Once you know the settings to change for IE it’s pretty straightforward to remove the security prompts.  I should say that I’m no expert in IE and I’m not sure of the security implications of making these changes so if you’re in a corporate environment check these settings with your Desktop Team.

NOTE: These are the version numbers of the applications:
CRM: Microsoft Dynamics 365 Version 1612 (8.2.2.111) (DB 8.2.2.111) online
SSRS: SQL Server 2014 SP1 (Version 12.0.4100.1)
Internet Explorer (IE): Version 11.0.9600.18817


Photo by William Iven

Using Power BI with Dynamics CRM 365

Background

Recently I was asked by a client to look into the possibility of using Power BI Dashboards/Reports and displaying them inside their CRM Online instance.  One of the priorities for the investigation was to ensure that the dashboards/reports could be filtered for the current user.  For my test I want to be able to build a dashboard that shows the CRM activities for the logged in user.


Initial Investigation

Power BI licensing looks very reasonable.  No cost to author reports and publish online, and $9.99 (approx £7.50) for the Pro version which gives the ability to be able share reports and schedule data refreshes.  Also, a quite lengthy 60 day trial is available which is plenty of time to see if it’s right for you.  After a bit of reading it seems that Power BI can be set to suck in data from a number of data sources, store it internally, and then build very nice looking charts from the data.  The data can be set to refresh at regular intervals, though the minimal refresh period is 1 hour, and this scheduled data refresh requires a Pro license.


Data preparation in CRM

To enable me to test the reports/dashboards I’ll be using the CRM Activity entity.  There are a few dozen records in my test CRM instance, and I am the owner of one of the activity records.


Power BI Desktop

Using my MSDN account I created an Azure Virtual Machine running Windows 2012R2 and installed the Power BI Desktop.  It’s free to install and use (the installer is 143MB).PowerBIDesktop

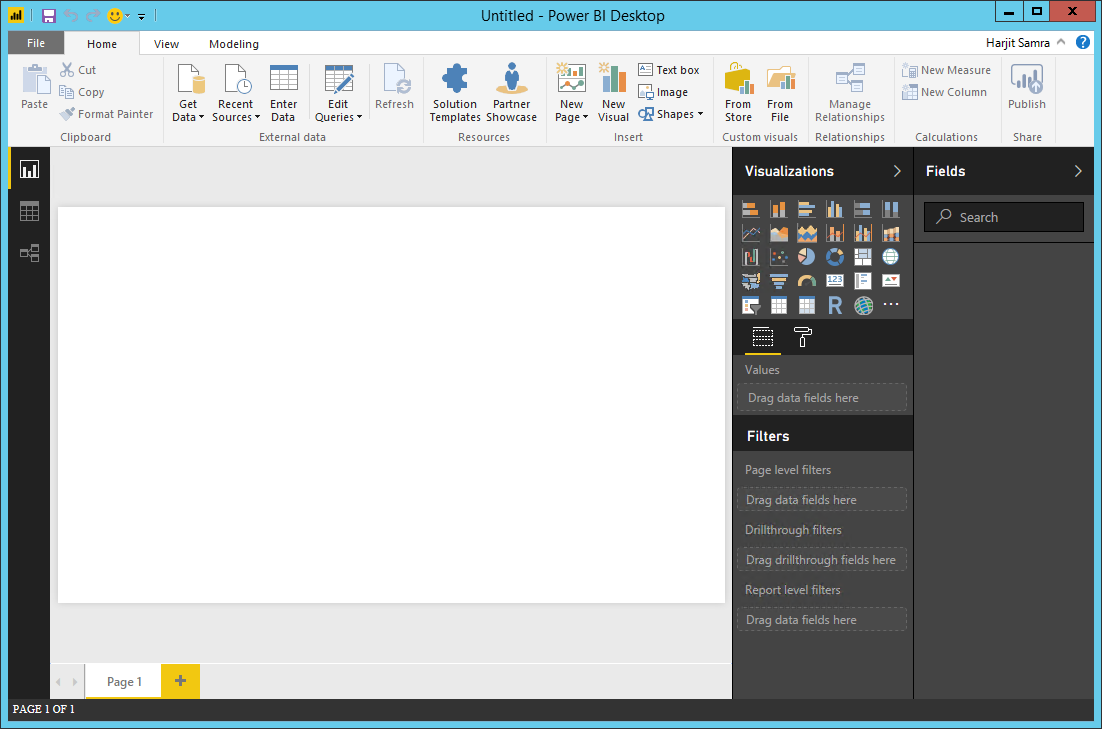
Adding Data to Power BI

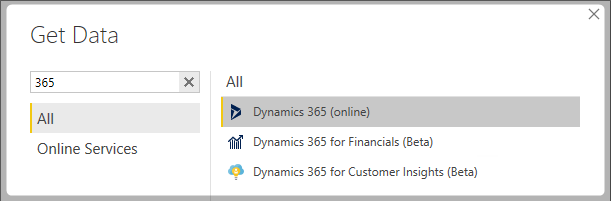
Clicking on the Get Data button brings up a dialog with a list of many available data source types.   Entering 365 into the search box filters the list allowing the selection of ‘Dynamics 365 (online)‘.

DataSources

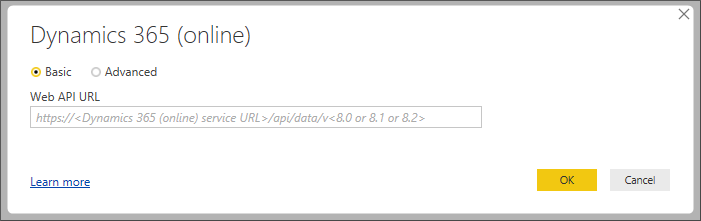
The next dialog prompts for the Web API URL for the CRM instance:

EnterWebAPIDialog
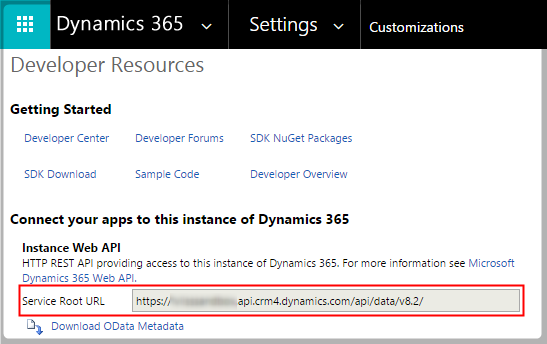
The Web API URL for your instance of CRM can be found by navigating to Settings\Customizations, clicking on Developer Resources, and copying the value out of Service Root URL.  Selecting the value with your mouse and then using Ctrl+C will copy the value.

WebAPIURL

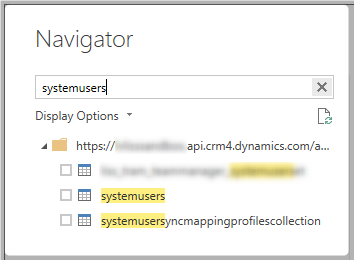
Next is a prompt for my CRM login credentials.  Having entered the credentials a list of entities that are in the CRM instance is displayed.  I selected systemusers and activitypointers – filtering the list using the search box makes it easier to find an entity:

FilterEntityList

Filtering Data by User

The data can be filtered to only show data for the current user by using Row Level Security (RLS).  RLS is basically how you can configure the data to be filtered by criteria which is configured per role.  I will simply be adding a role to filter the systemusers table for the logged in user, and as the activitypointer table is joined to this table, it will be filtered also.
The first step is to make a one-to-many join between the two tables.   This is achieved by clicking on the relationships tab to go to the mapping screen.

RelationShipsTab

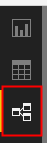
From here the two tables are visible, and can be resized to view more of the columns.  To create the link drag the systemsusers ownerid column to the activitypointers _ownerid_value column:

DragColumns

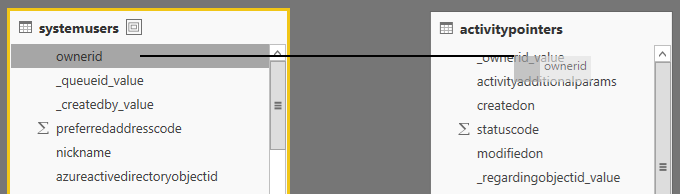
There should now be a line linking the two tables with a 1 on the systemusers side and a star on the activitypointers side.  Double clicking the join allows the properties to be viewed – it should be:

RelationshipDialog

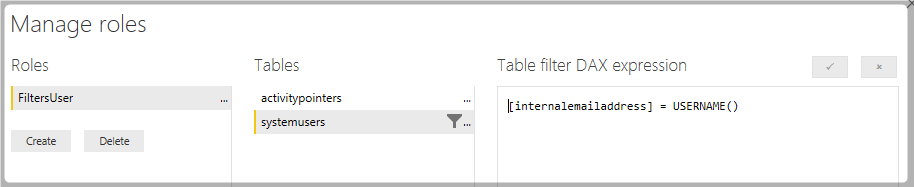
The next step is to add the filter.  Click back to the Home tab and then the Manage Roles button:

HomeTab  ManageRolesButton

This is the filter that should be added:

RLSFilter

Displaying Data

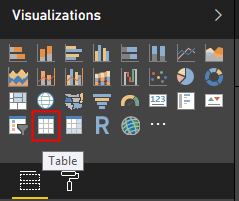
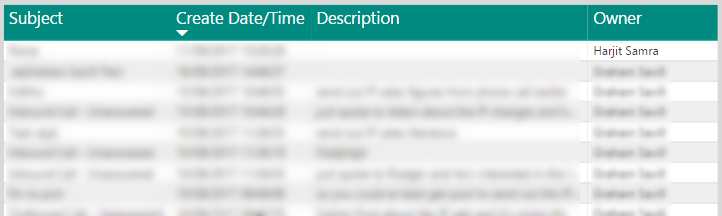
We can now add the data to the main view area.  For our test a simple grid of data will be sufficient.  On the list of Visualizations click the Table icon:

TableIcon

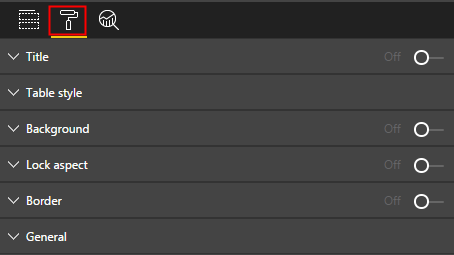
This inserts a table onto the main view area and columns from the far right table can now be dragged onto it.  Formatting the table is done by selecting the table, then the ‘Paint’ icon and changing the values.

PaintIcon

This is how mine looks:

FinishedTable


Testing

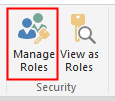
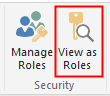
It’s very important to test what we’ve done as we don’t want users seeing other users data.  Click on the ‘View as Roles’ button:

ViewAsRoles

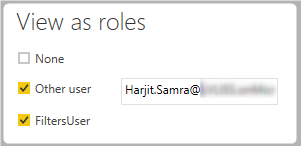
Then enter the following selections, using your email:

ViewAsRolesEntry

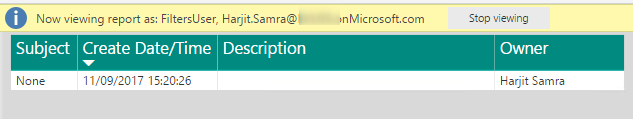
The data in the table should now be filtered to display just your data:

FilteredDataInTable

Publishing

The next step is to Save and Publish the Dashboard to Power BI Online.  This is done by clicking File\Save (mine is called CRMUserActivities) then File\Publish  and then Publish to Power BI.
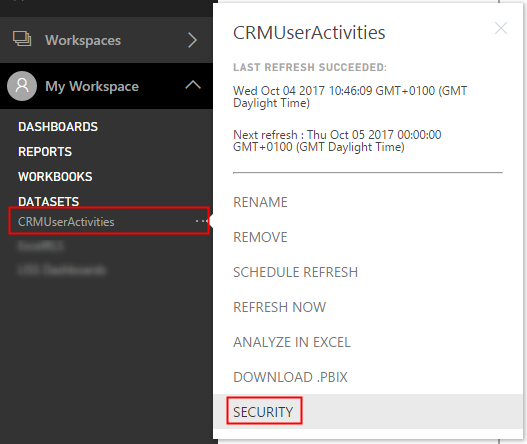
Next, go to the Power BI application website.  The next step is critical also, as we’re going to configure which users the Filtering applies to.  Expand ‘My Workspace‘ and under DataSets there will be your dataset.  Click on it, then click the ellipsis, and the menu option Security:

DataSetSecurity

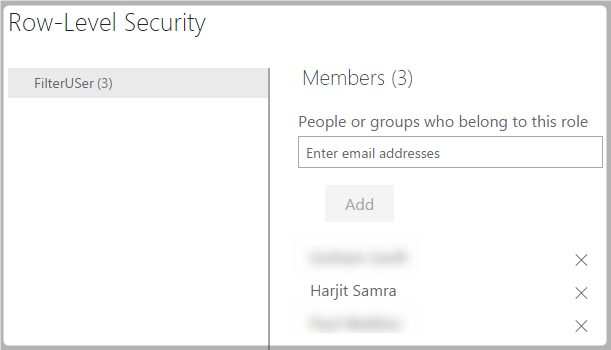
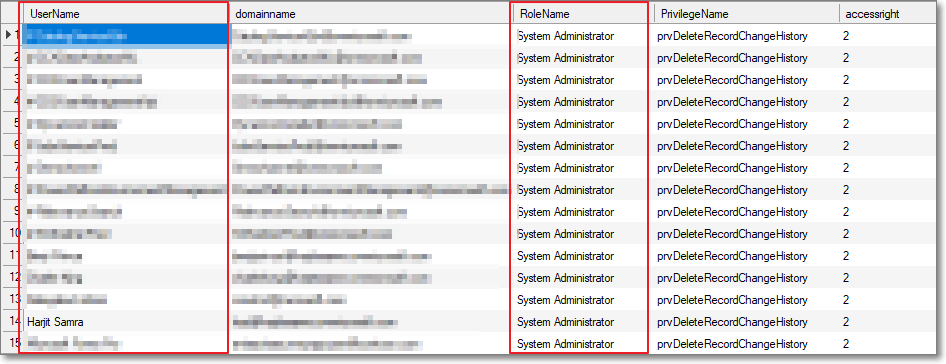
Now, all the users should be added to the Row-Level Security.  This can be a bit tedious but I don’t think there is any way around this:

RLSMembers


Convert Report to a Dashboard

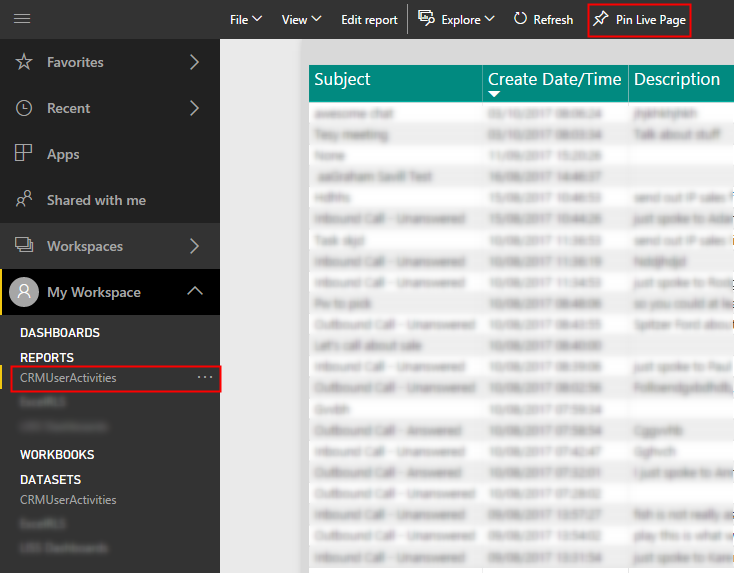
To convert the report to a dashboard that is viewable on CRM the first action is to open the report and click on ‘Pin Live Page’

PinLivePage

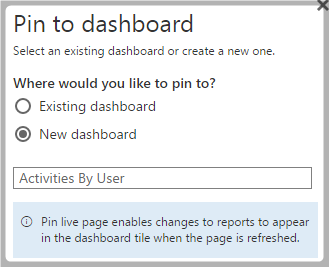
A dialog is displayed and ‘New dashboard‘ can be selected and the name of the dashboard entered:

PinToDashboardDialog

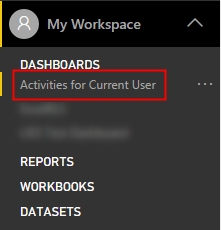
By default Power BI displays Report page numbers which can make the dashboard look a bit untidy.  Removing the page numbers is not very intuitive, and it took me a while to figure out how to remove them.  Firstly click on the new dashboard that has been created under the My Workspaces tab:

OpenDashboard

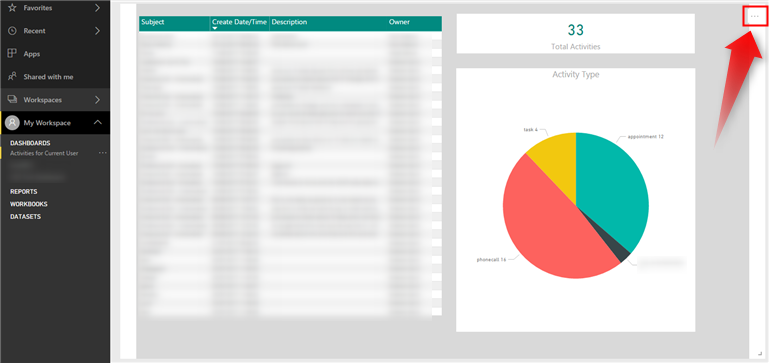
The next step is a bit tricky.  Move your mouse over the dashboard and an ellipsis should appear to the top right.  Click on this ellipsis:

DashboardEllipsis

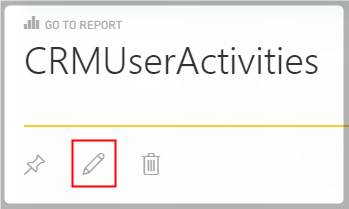
This brings up another menu, click on the ‘Pencil’ icon:

DashboardSubMenu

Finally, we are on the correct the window.  Untick ‘Display title and subtitle‘ and then click Apply.

DashboardTileDetails

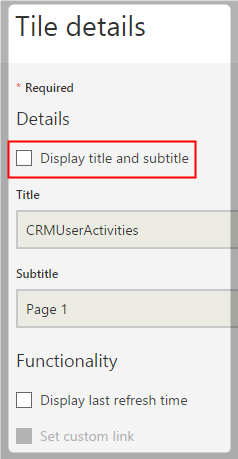
Note: There is also an option on this dialog to ‘Display last refresh time’.  This is the date/time the Dashboard was refreshed by Power BI – an item you may want to show to yours users.

Add the Dashboard to CRM

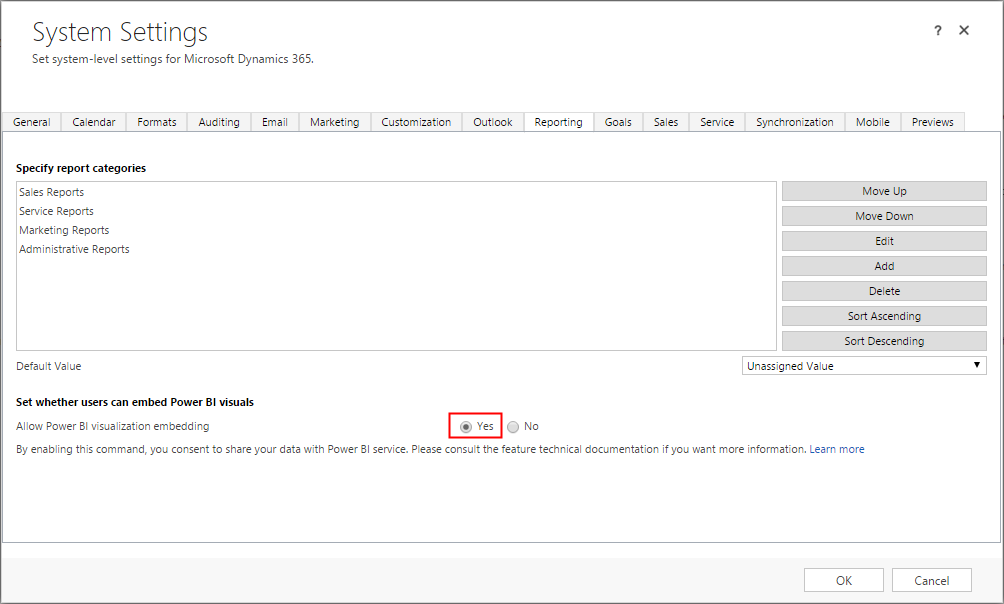
We’re nearly there..   To enabled Power BI dashboards in CRM there’s a setting under Settings\Administration and then System Settings.  In the Reporting tab there’s an option to enable Power BI Dashboards – set this to Yes:

CRMSystemSettings

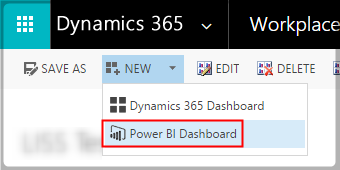
In CRM, go to the Dashboards screen, and click on the arrow to the right of the New button, and select Power BI Dashboard:

CRMPowerBiMenu

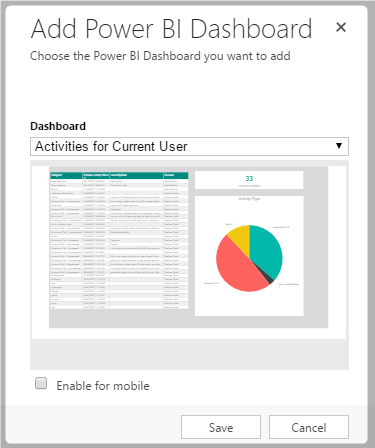
And finally you can select your Power BI Dashboard

CRMPowerBiDialog

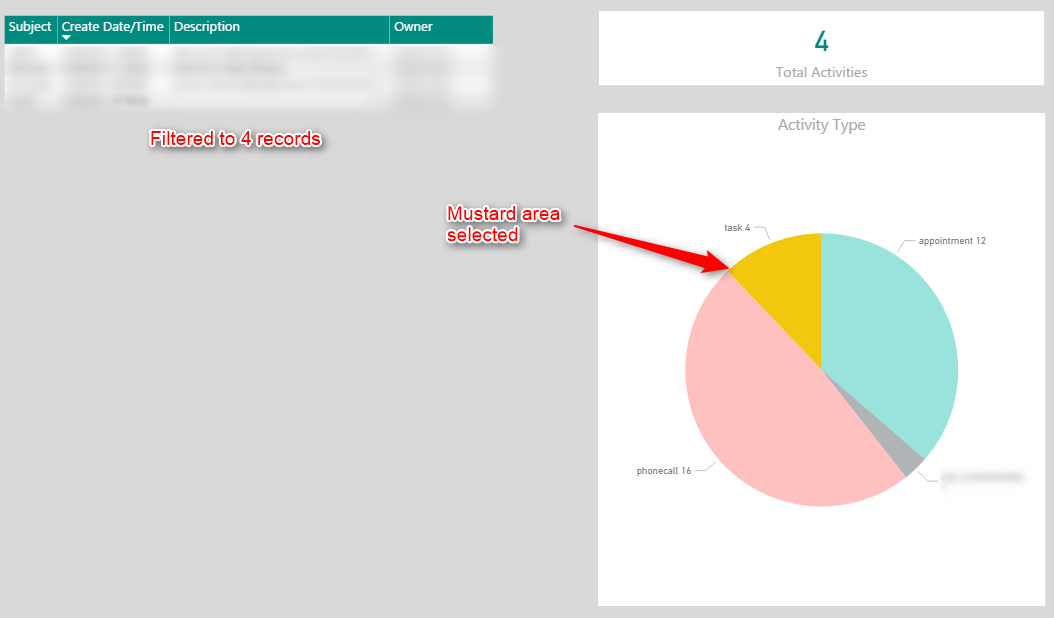
I also added a pie chart and a total count to my dashboard.
An added bonus is that Power BI Dashboards are interactive, in that you can select records in the table, or items in the charts and the other tables/charts will update accordingly.   For example:

Select records in the table

Dashboard-RecordsSelected

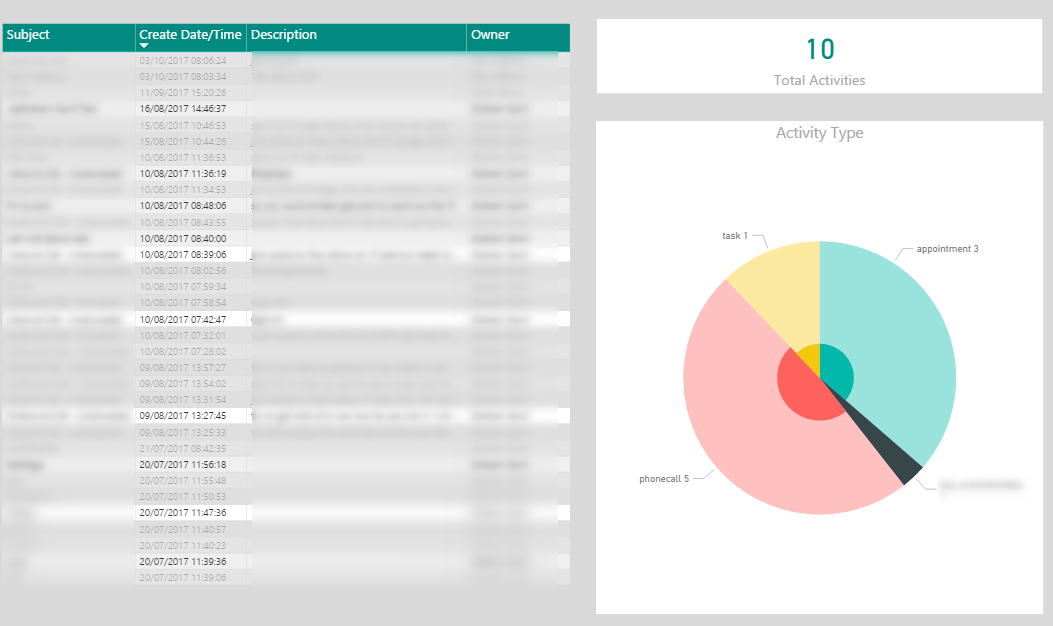
Selected items on the chart

Dashboard-ChartAreaSelected


Testing Dashboard if you’re the Creator

On creating my first dashboard using this method it didn’t appear to work and after some time I realised that the creator of the dashboard sees all of the data.  This can be a bit confusing – I’ve read it’s because the creator of the dashboard is the owner of the report and the dataset.
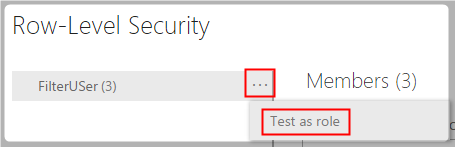
There is a method of testing the Dashboard if you’re the creator/owner.  Go back to the  Power BI application website, open the dataset Security settings:

DataSetSecurity

Then select the RLS item, click on the ellipsis, and click on ‘Test as role’

PowerBITestAsRole

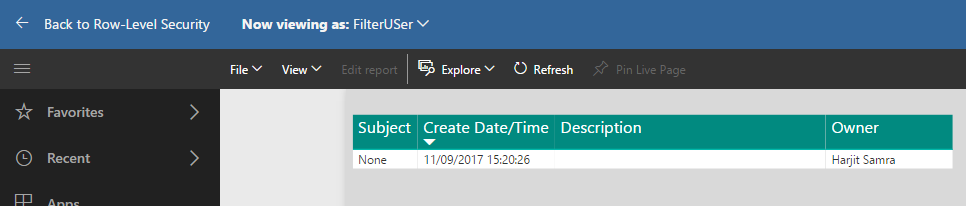
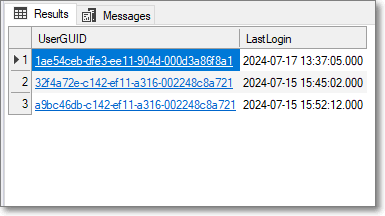
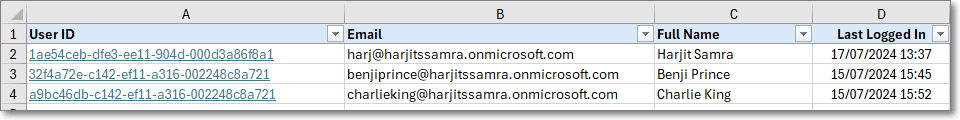
You can now test the Dashboard using your data:

PowerBiViewAsTestRole

What Power BI dashboards should not be user for

Power BI dashboards can be made to use live data vis streaming, but the method described above uses data that is updated on a scheduled basis.  This means that they shouldn’t replace normal CRM dashboards where the data is refreshed live, i.e. outstanding customers to call.

Conclusion

I hope this gave you a good introduction to Power BI and CRM and what they are capable of in terms the creation of meaningful interactive Dashboards.
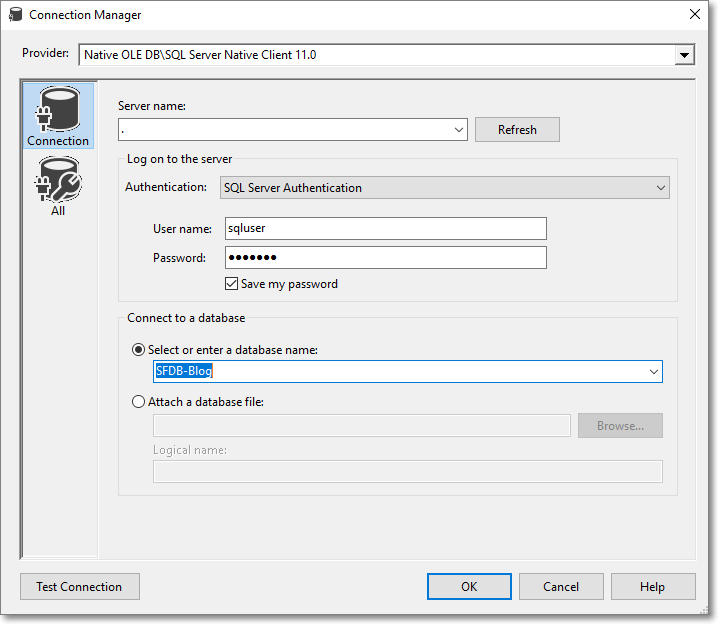
 

Photo by Carlos Muza