
I do many multi day trips on my motorbike, and rack up a lot of storage on SD cards. There’s the helmet camera, the camera facing me, the drone, and DSLR camera.
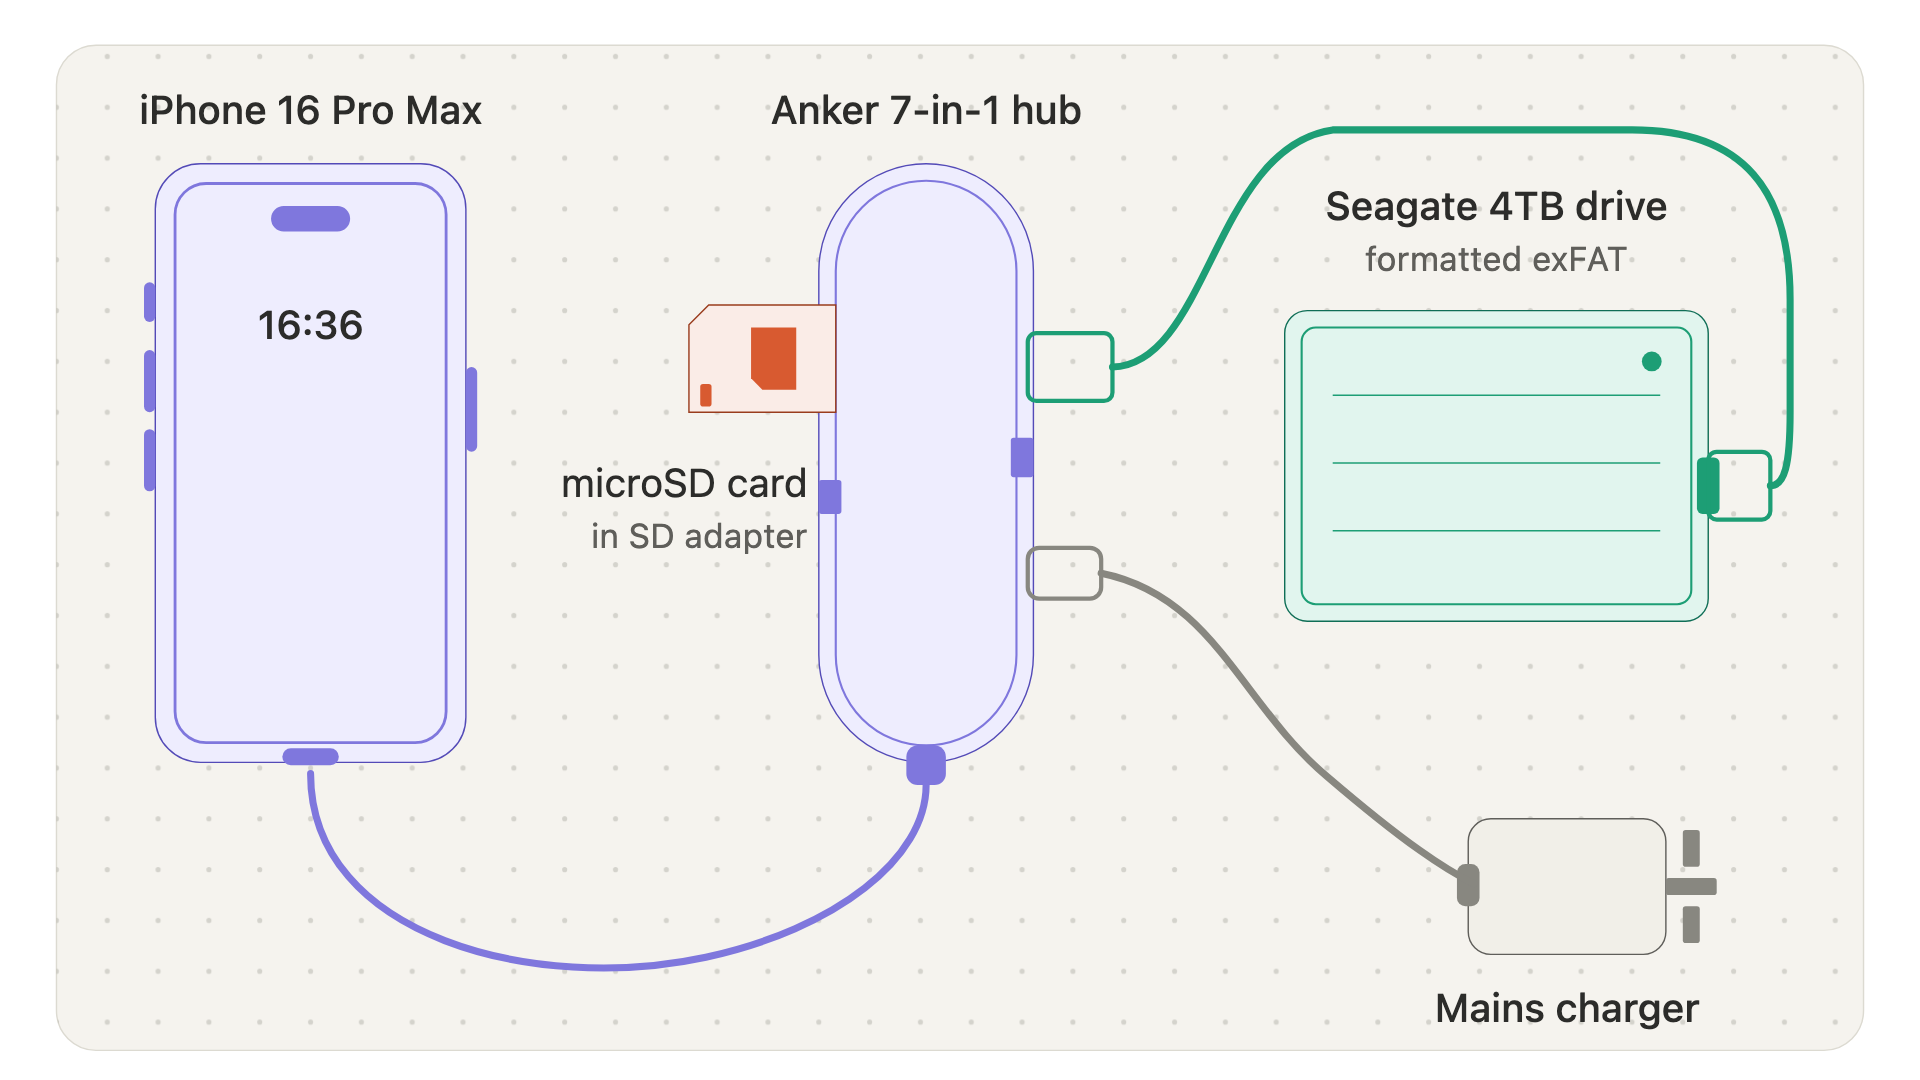
So here’s the setup I use to get a day’s photos off SD cards and onto a 4TB drive from a hotel room, using nothing but my iPhone and a few accessories. (for Android see end of post)
It is possible to use a laptop to copy the files, but this kit is a lot lighter and less bulkier than a laptop.
The Kit
- Anker 7-in-1 USB-C adapter. The ports that matter here: SD, microSD, USB-A, and — the important one — USB-C power delivery. link
- A 4TB portable hard drive. Big enough that you never think about it again. A fortnight of RAW files and 4K clips barely dents it, and you can keep several trips on there before it needs emptying. link
- A USBA to USBC adaptor between the drive and hub – optional. It’s slightly quicker copying with USB-C. link
- An iPhone. I use a 16 Pro Max, but this works with most iPhones. Anything from the iPhone 15 onwards has USB-C and plugs straight into the adapter.
- A power source — your phone charger.
* Affiliate links
Before you leave: format the drive to exFAT
Do this at home. Format the drive as exFAT. It’s readable by iOS, macOS and Windows, and unlike FAT32 it handles files over 4GB — which matters the moment you shoot any video at all.
- On a Mac: Disk Utility → select the drive → Erase → Format: ExFAT, Scheme: GUID Partition Map
- On Windows: right-click the drive → Format → exFAT, allocation unit 128KB or larger
Then test the whole chain at home. Copy one folder end to end. You don’t want to find there’s an issue when you’re in your hotel room.
The hotel room routine
1. Power the hub first. A 4TB spinning drive draws more current than an iPhone will hand out on its own. Plug your charger into the adapter’s USB-C PD port before you connect the drive.
2. Connect everything. Adapter into the phone, drive into a USB-A port, SD card into the slot.
3. Kill auto-lock. Settings → Display & Brightness → Auto-Lock → Never. iOS will happily stall a long transfer when the screen sleeps. Turn it back on in the morning.
4. Open Files → Browse. Under Locations you’ll see both the card and the drive. Open the card and find DCIM.
5. Make a dated folder on the drive. 2026-07-31 Day 3 Snowdonia. Something you’ll still understand in six months.
6. Copy — never Move. Tap Select → Select All → Copy. Go to your new folder and Paste. Move deletes from the card as it goes, and until that copy is verified the card is still your only original.
7. Walk away. Reckon on 10–20 minutes per 64GB through a hub. Leave Files in the foreground and go and have a shower.
Verify, then wipe card or store.
When it finishes, long-press the folder on the drive and check Get Info. Does the file count match the card? Does the size look about right?
Then, format the card from Files – make sure you format the card and not the drive!
If you want to be extra careful carry enough cards for the trip and rotate them instead. A full card zipped in your jacket plus a copy on the drive is two copies in two places.
Does this work on Android?
Yes, Android 11 or later will work, because that’s roughly when native exFAT support stopped being an OEM extra and became something you could just assume. A Samsung on Android 9 will very likely be fine; a budget handset on Android 13 might not
One thing to test at home before you rely on it: some phones will only mount one USB volume at a time through a hub. If the card and the drive won’t appear together, the direct copy is off the table and you’re staging everything through the phone’s own storage — which defeats the entire point.
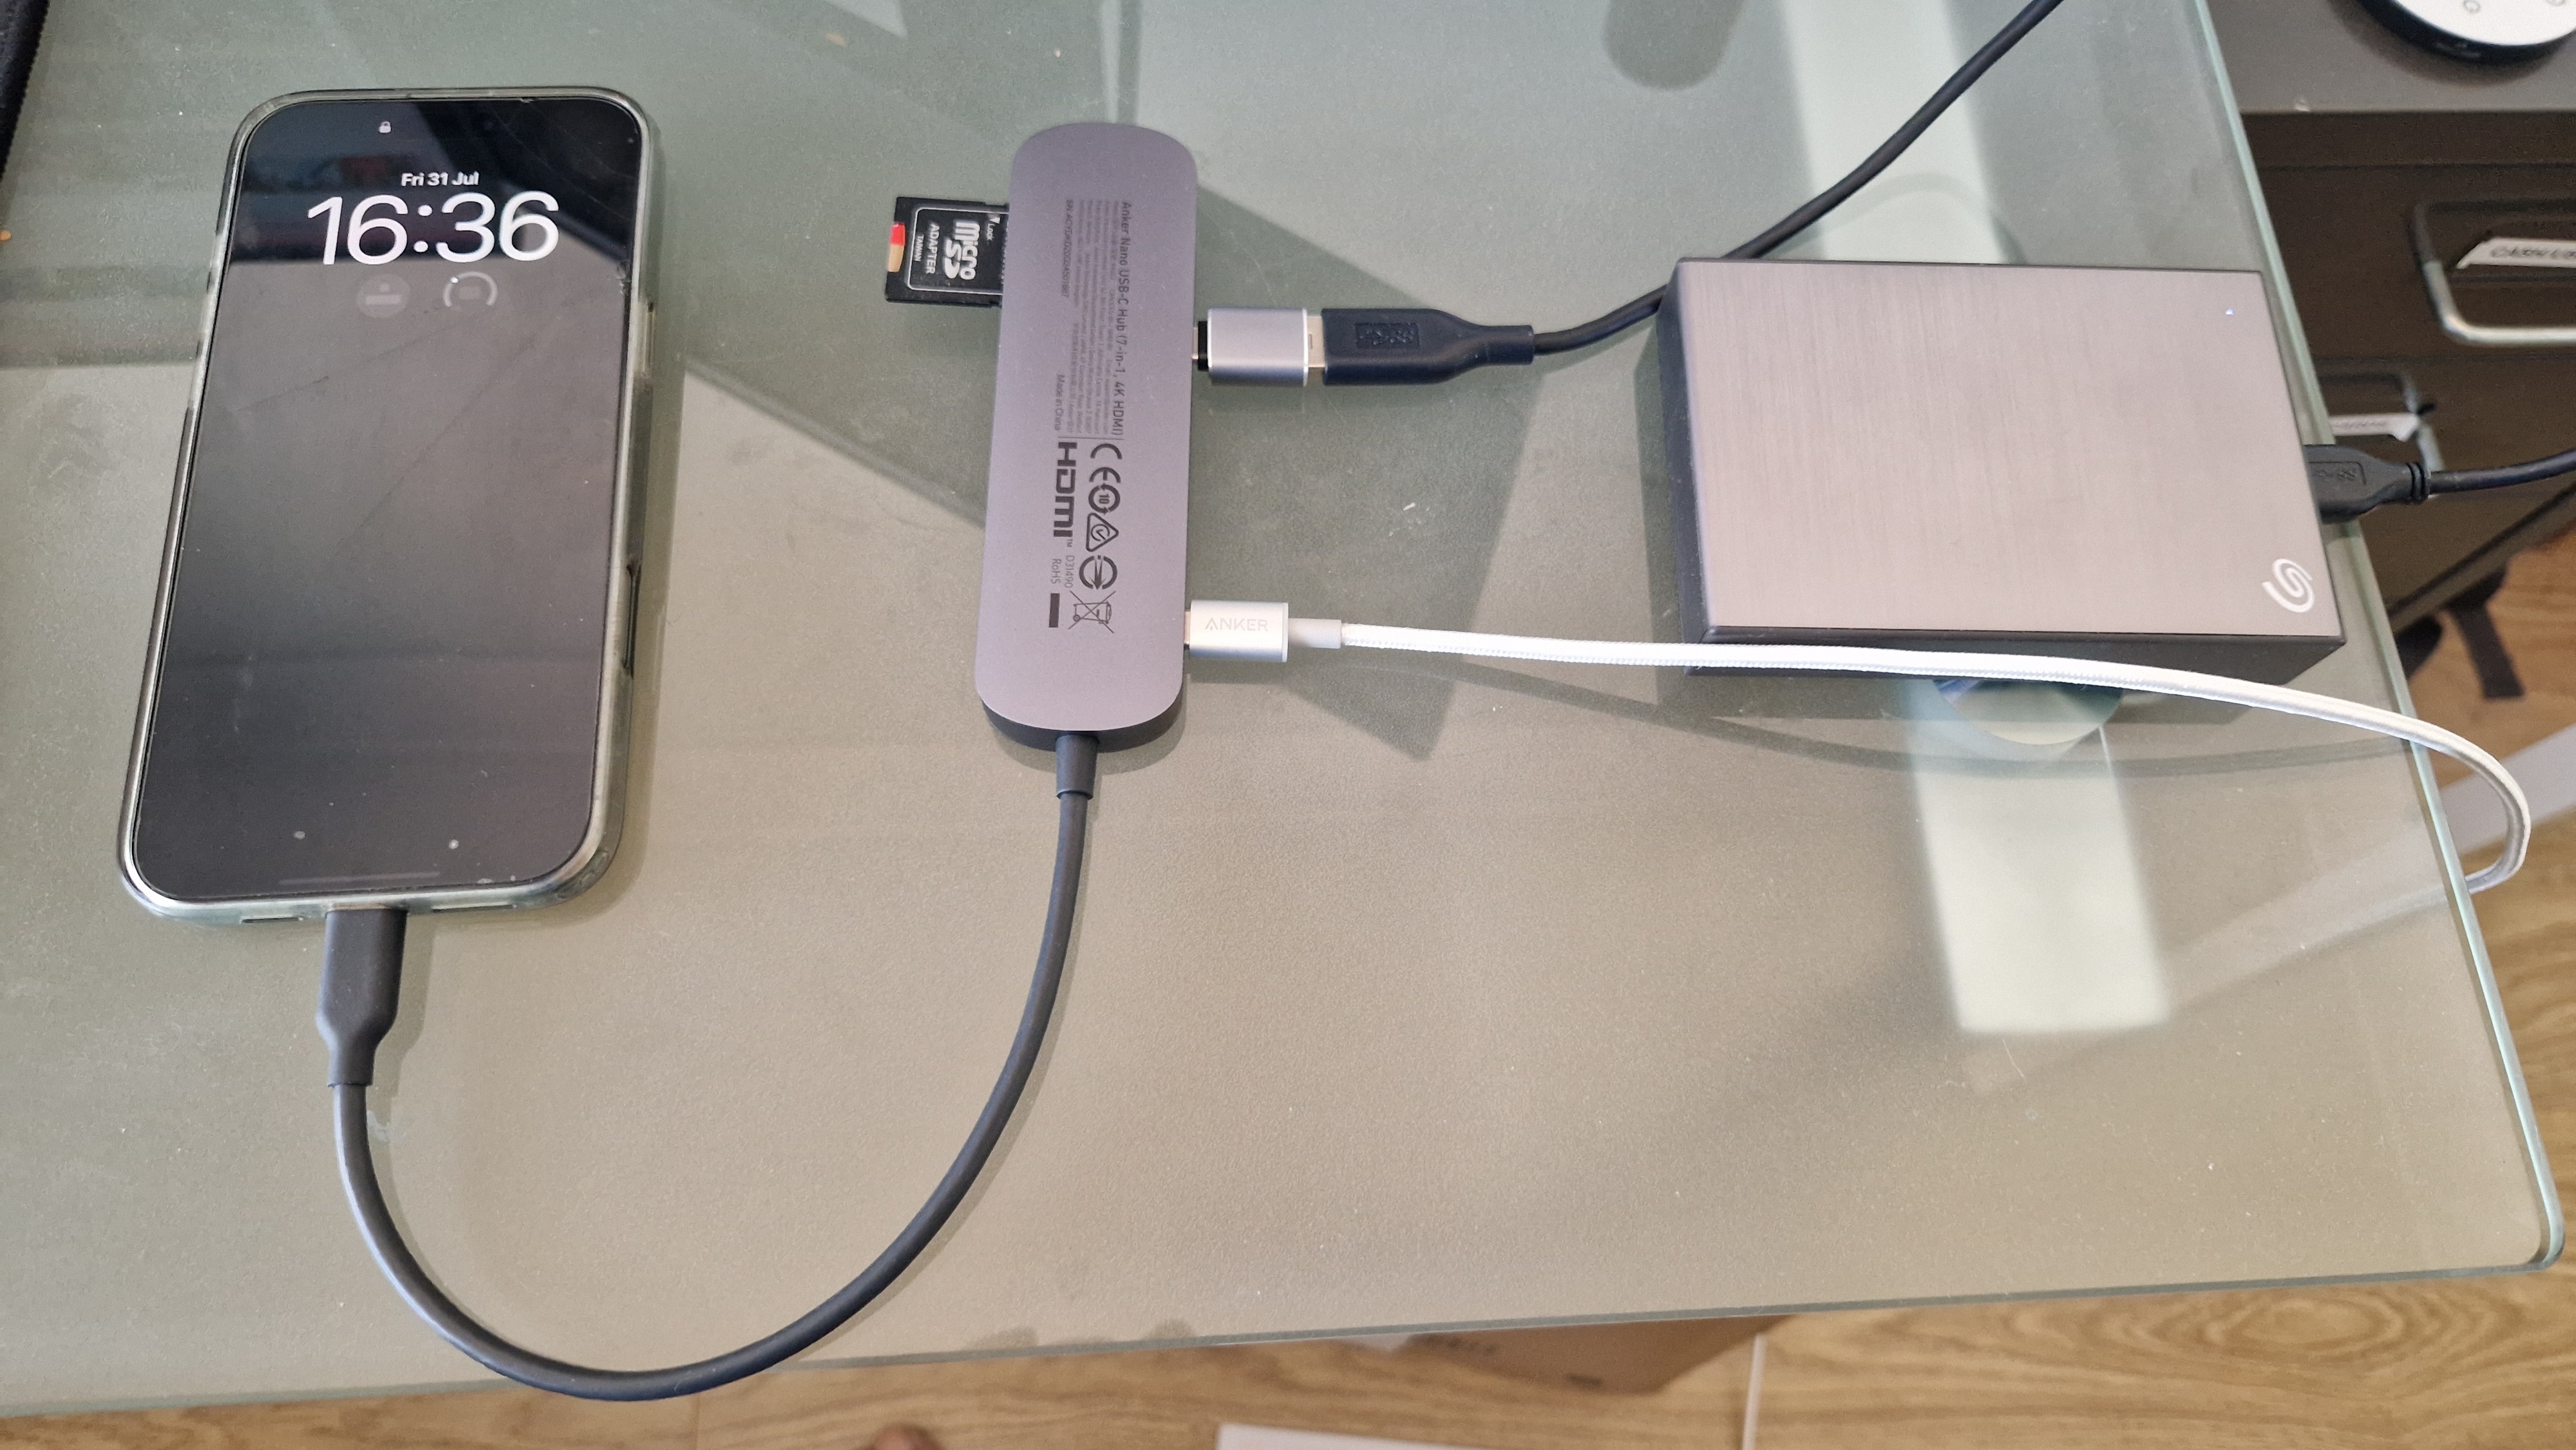
Conclusion
This is a photo of the setup on my desk.