
There is a lake a short walk from where I live, which has an abundance of wildlife.
Theses are some photos I took there in May 2023.


There is a lake a short walk from where I live, which has an abundance of wildlife.
Theses are some photos I took there in May 2023.
We had booked to go to Kefalonia with TUI in May 2020, but that didn’t go ahead, so we rebooked and went in June this year. We stayed at the Apollonion Resort & Spa, which was a very luxurious hotel but ultimately a bit far out from the main island than we would have liked.
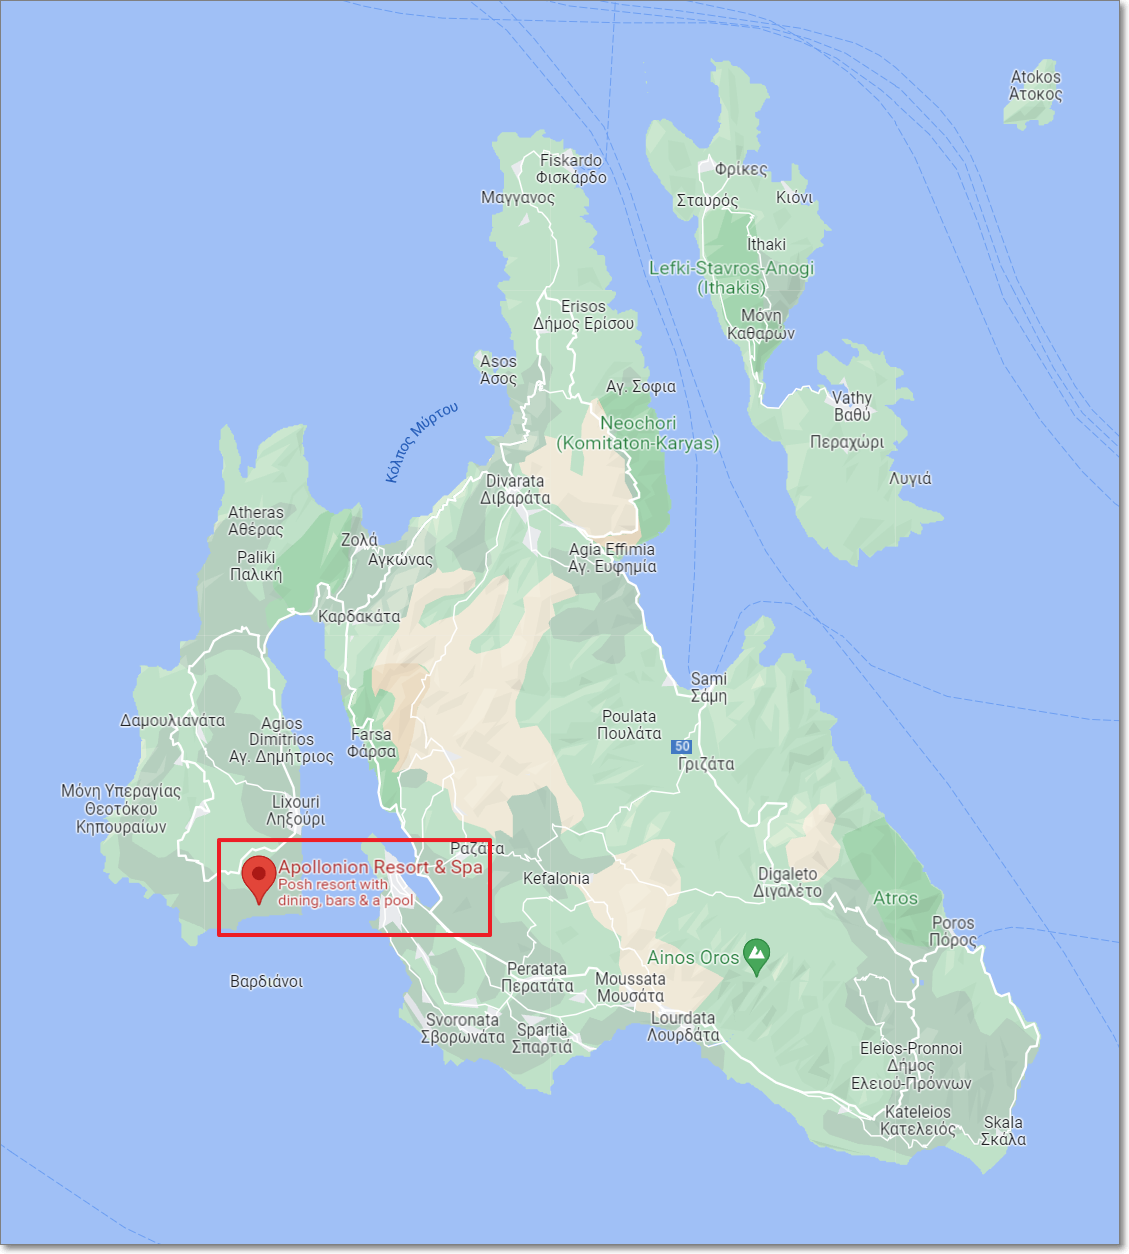
There is a car/person ferry which goes every 30 mins from Lixouri to Argostoli which saves the 30-45 min drive around the coast


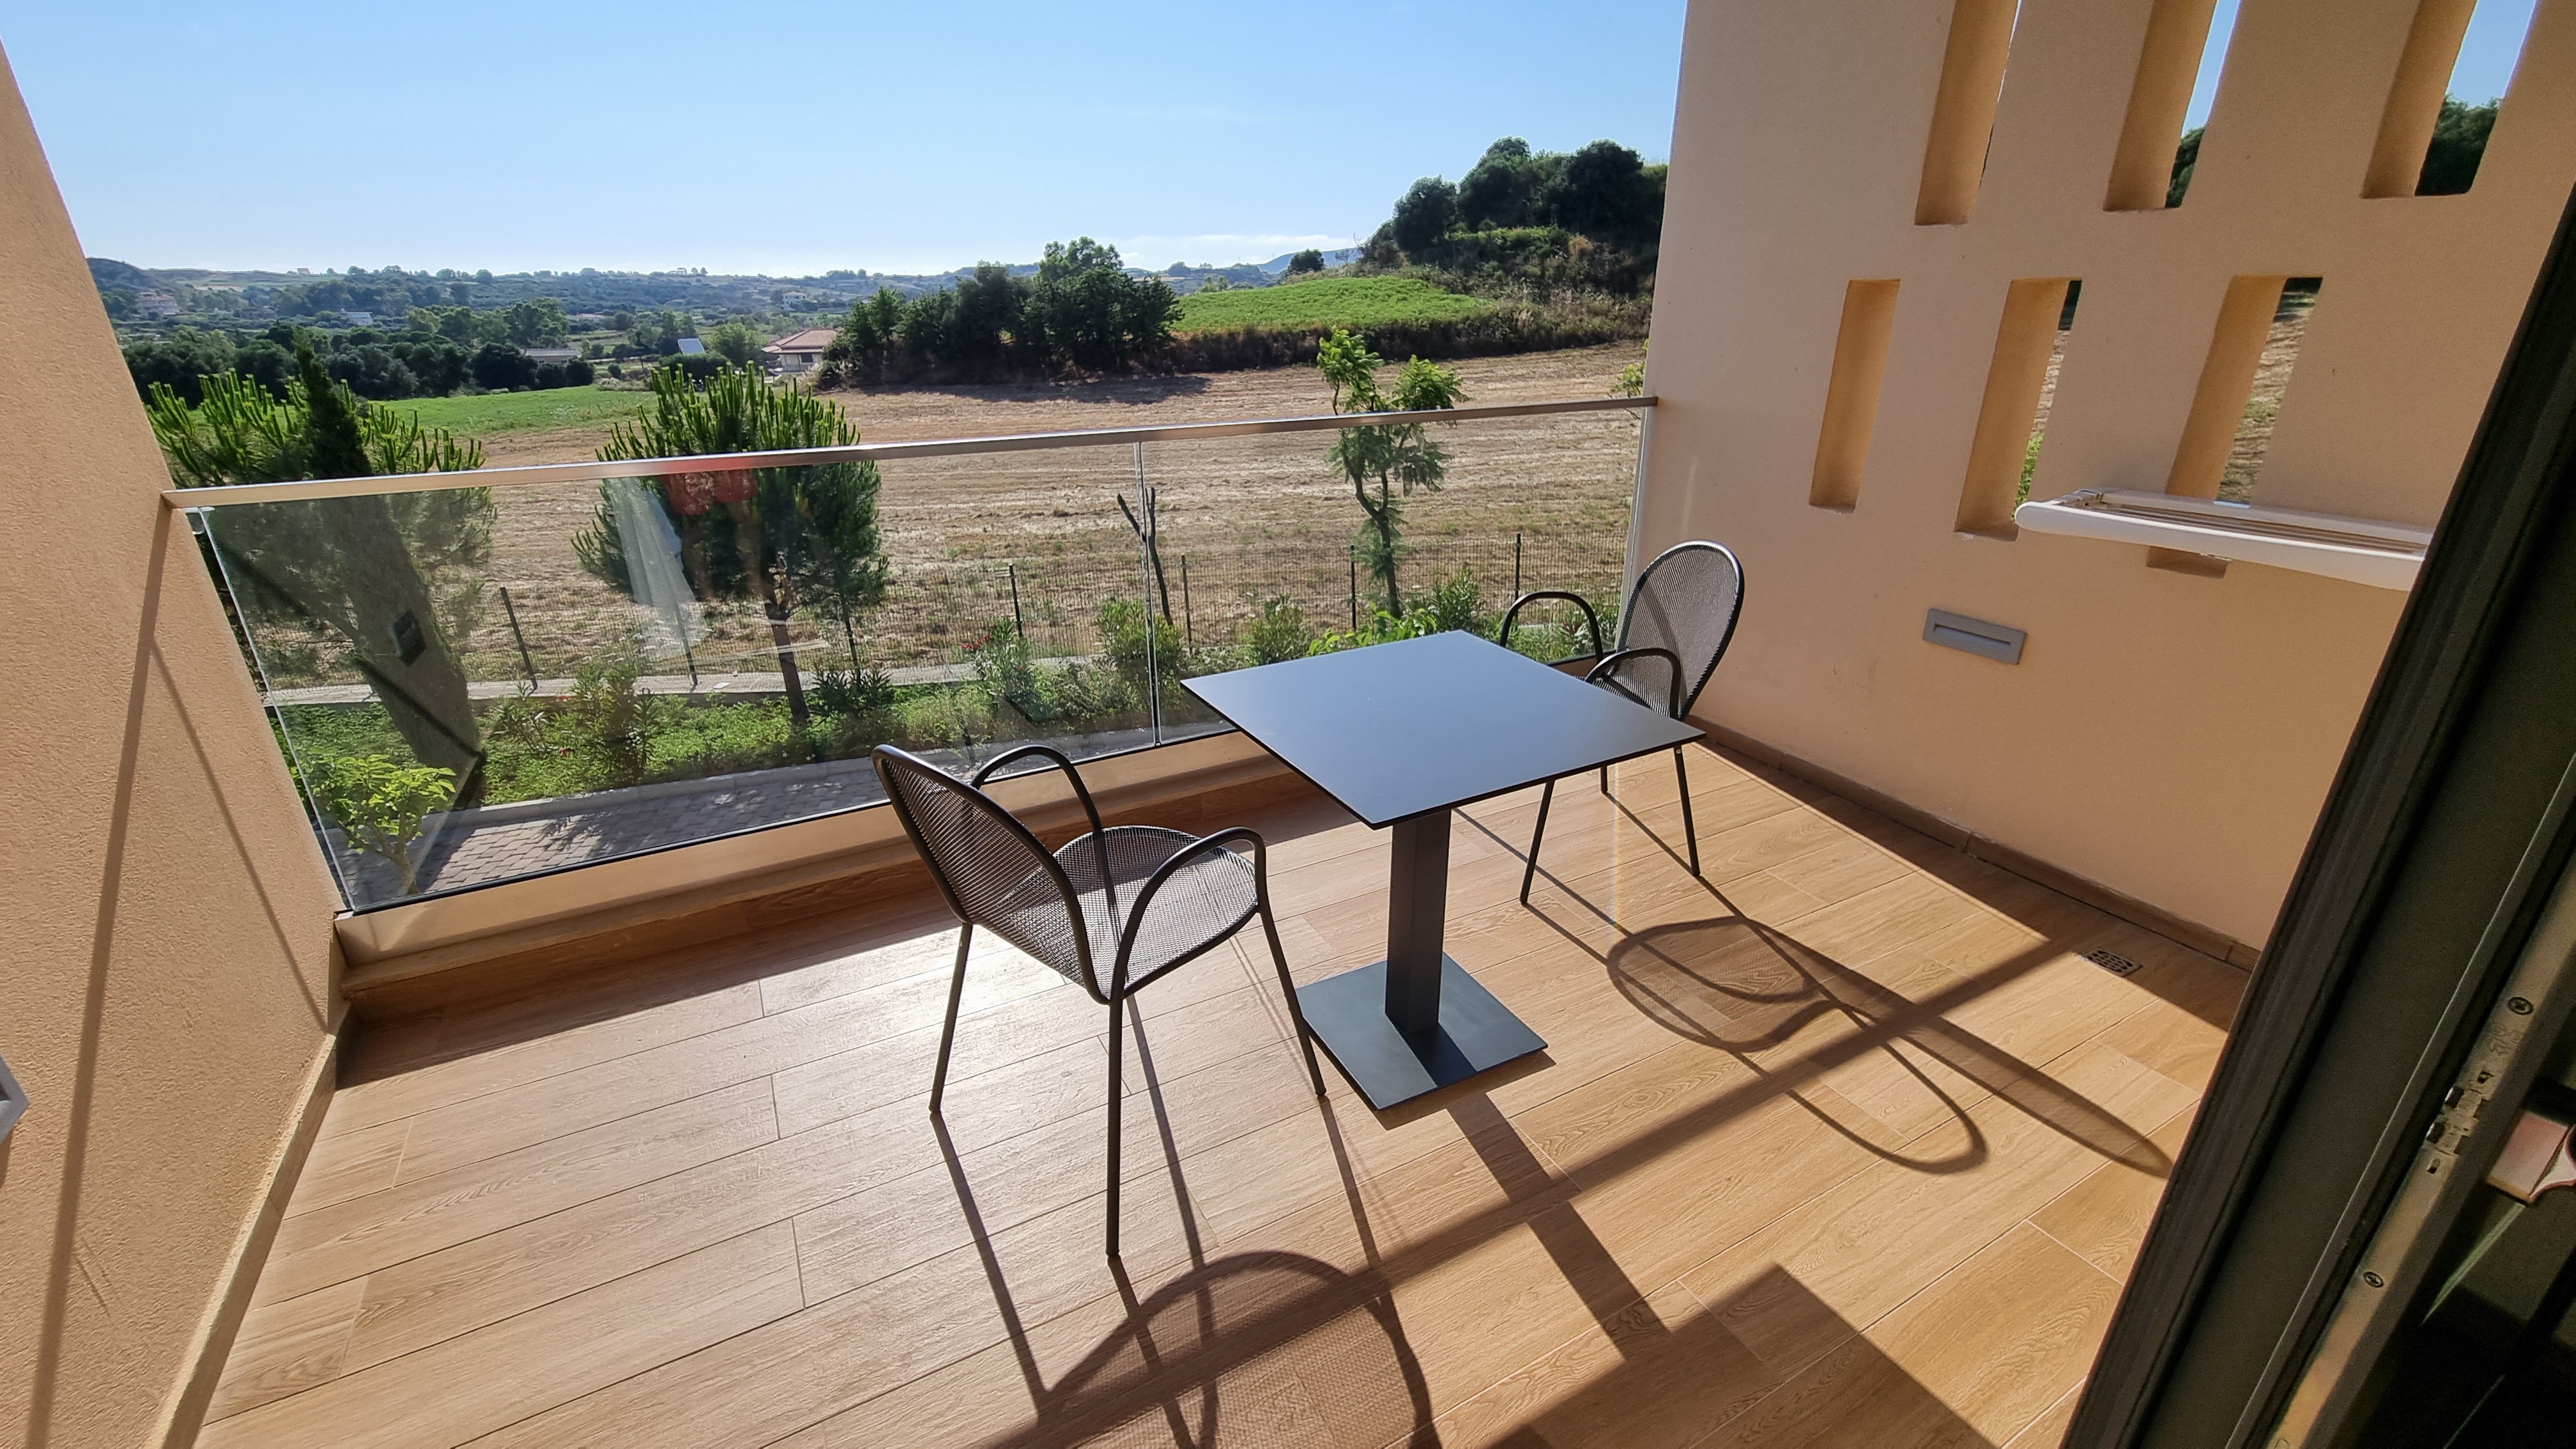
The hotel itself was very nice – parking outside our front door, and a very quiet balcony.


There seems to be a shortage of hire cars in many places, and there was no exception here. I did find someone through Facebook who provide excellent service – https://www.facebook.com/acerentacarkefalonia.

There are a large number of beaches to explore on Kefalonia – here are a few of them:


Of course there was the obligatory 1 day scooter rental (rented from http://motoround-kefalonia.gr/en/). There are some excellent remote spots to see around the island.

This is the route I took. I started from Argostoli, headed South, past Skala, then back up the East Coast, before heading South West back to Argosoli.
Finally, a selection of photos from the week.


THE FINISHED APP
An animated 3D Rubik’s Cube in Power Apps.
The fully working Power App app can be download from GitHub.
BACKGROUND
Following on from my previous post on creating a Rubik’s Cube emulator in Power Apps, the next logical step was to have the cube sides animate on rotate. There is a draggable 3D cube in this website – which renders in real-time, but I don’t think this is yet within the realms of Power Apps.
I had the idea of rendering each frame of a side rotating and then switching these frames within Power Apps resulting in the animation. The frame would also need to reflect the colours of the pieces, which would be possible using the same method as for the static cube, i.e., replacing the polygon colours in the SVG with the appropriate piece colour stored in the Collection.
Also, as the sides are rotated the notations are stored in a collection, and then an ‘Unscramble’ button will replay all the moves in reverse resulting in a completed Rubik’s Cube.
The standard notations for Rubik’s Cube movements are taken from this page.


CREATING THE FRAMES
After a bit of searching online – Blender seemed to offer an SVG export feature as an add-on. Downloading and using Blender was a bit alien to me as I’m accustomed to Autodesk Maya and 3D Studio Max. So instead, a trial of Autodesk Maya was installed, and on looking at the render engines available I found that there is one called Maya Vector renderer which is able to export to SVGs – this sounded perfect.
Next, I found a YouTube tutorial and created the Rubik’s Cube in Maya, even though it’s not a particularly complex shape to model. In terms of the colouring of the pieces they each have to be unique so that the colour code can be replaced in Power Apps. This was achieved by using a fixed colour for each side and then lowering the saturation on each piece, so that none of the colours would be repeated. This is the completed model rendered in Maya Vector, and Arnold (the built-in Maya ray tracing renderer)


I decided that 5 frames in the animation steps would be sufficient as this would result in 3 frames between the start and end. Any less wouldn’t look very realistic, and using more might slow down the animation as Power Apps would have to render all of the frames behind the scenes even if they’re not visible.
I won’t go into detail of the process of animating each side move in Autodesk Maya. As a summary the steps are:
The SVGs created from Maya weren’t very well formatted, or easy to read. Importing them into Adobe Illustrator and re-exporting them resulting in them being half the file size, and also the SVG colour “styles” being created at the top of the file – which makes things a lot simpler.
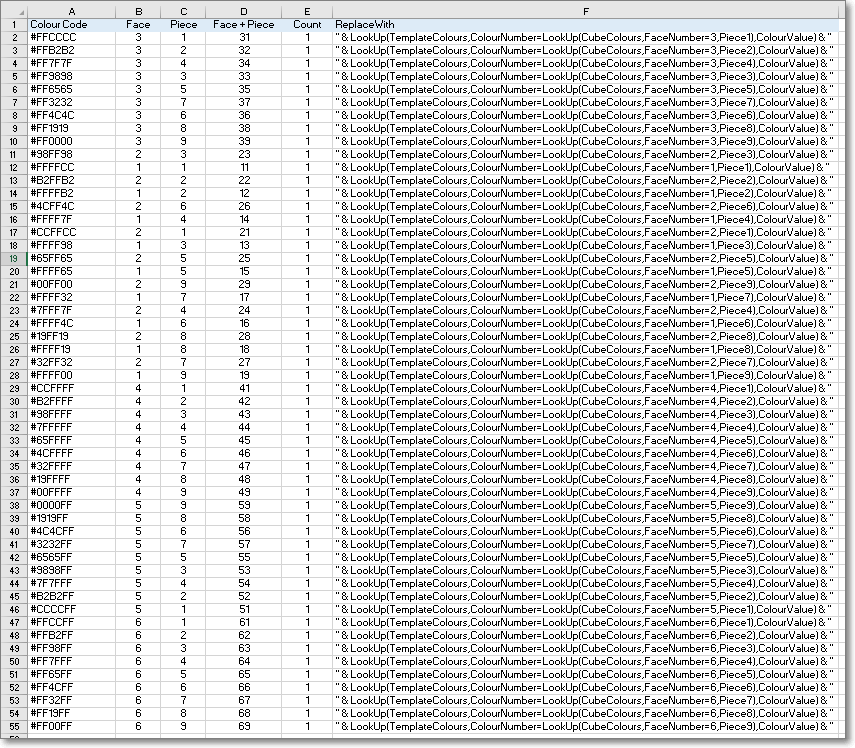
The next step is to replace the appropriate piece colour in the SVG file with the Power Apps lookup code for the corresponding side and piece. Through a process of importing the SVG into Power Apps and then changing each style colour to black I was able to create the below spreadsheet with the piece colour and its matching Power Apps code:
The process of searching and replacing the colour codes with the Power Apps codes initially wasn’t straightforward. This page describes how to perform multiple text replacements in in Excel using VBA code.
The final steps for preparing the Maya SVGs for Power Apps are:
POWER APPS
There is not much in the App that is overly complex – I’ll cover anything that might require an explanation on how it works.
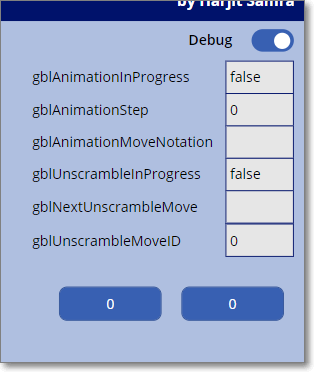
Several variables are used in the side animation and the cube unscramble routines. These variables values can be hidden or displayed using the Debug toggle control:
Two timers are used – the first to increment the variable controlling the animation frame displayed, and the second controlling the Unscramble routine.
On Version 1 of the app I’d forgotten to rotate the colours on the actual side of the cube which is being rotated. This has now been fixed.
Image controls including SVG for the Image properties were added for all of the frames of the side move animations. The images Visibility is set by the several variables indicating if an Animation is in progress, the move notation, and the frame of the animation.
FINAL THOUGHTS
It would be great to be able to render the Rubik’s cube in real time in 3D. This may be possible by creating an SVG on the fly to draw lines and polygons. I’m not sure if this could be done in Power Apps but I like a challenge 😊.
Photo by Fakurian Design on Unsplash
BACKGROUND
Is it possible to create a Rubiks Cuber emulator in Power Apps?
Recently a Twitter post from Mr Dang piqued my interest. It was a retweet of a tweet which showed an Excel spreadsheet with a 3D Rubiks Cube which could be rotated by using buttons around the cube. I had been looking for a new idea for a new Power Apps project and this looked ideal.
When I was about 10, I became interested in the Rubiks Cube, and spent many hours learning how to solve it in under a minute, and amazed anyone who was willing to watch me do it.
TERMINOLOGY
These are the terms used when referencing the parts of a Rubiks Cube:
Cube – the whole cube.
Face – a single face, or side of the cube.
Piece – a single piece on a face, which can be one of six colours.
APP/CODE
The “code” snippets in this post will be minimal as the full working App is in Github here.
INITIAL THOUGHTS
Ideally, the goal was to create a fully 3D rendered cube which could be rotated, and the sides moved by dragging – as here. I believe this is beyond what Power Apps can do – for now..
I wanted to use as much Power Apps core functionality as I could in the App, to display, store, and move the faces. To store the piece colours the plan was to use Collections but was unsure if the performance would be adequate – turns out it was no issue.
FIRST STEPS CREATING THE APP
Created a ‘Reset Cube’ button and code in the OnSelect to create a Collection to store the 6 faces and 9 piece colours. Also, a gallery to display the Collection data on screen.
// Create new collection and create Face 1
ClearCollect (
	CubeColours,
	{
		FaceNumber: 1,
		Piece1: 1,
		Piece2: 1,
		Piece3: 1,
		Piece4: 1,
		Piece5: 1,
		Piece6: 1,
		Piece7: 1,
		Piece8: 1,
		Piece9: 1
	}
);
// Append Face 2
Collect (
	CubeColours,
	{
		FaceNumber: 2,
		Piece1: 2,
		Piece2: 2,
etc.
Added 9 Text boxes for each of the 3 visible cube sides, and a Lookup in each Text box to show the text value from the Collection:

So far so good – we can see the values of all the pieces, and the 3 cube sides on screen (although not in a very user friendly format).
ADDING COLOUR
A Collection was created to store the colour numbers 1 to 6 with their corresponding HTML colour values. The below code was put into the ‘Reset Cube’ button for ease.
ClearCollect (
    TemplateColours,
    {
        ColourNumber: 1,
        ColourValue: "#00FF00"// Green
    },
    {
        ColourNumber: 2,
        ColourValue: "#FF0000"// Red
    },
    {
        ColourNumber: 3,
        ColourValue: "#FFFFFF"// White
    },
    {
        ColourNumber: 4,
        ColourValue: "#FF8040"// Orange
    },
    {
        ColourNumber: 5,
        ColourValue: "#FFFF00"// Yellow
    },
    {
        ColourNumber: 6,
        ColourValue: "#0000FF"// Blue
    }
);
The cube text boxes Text values were all set to “” (Blank) to clear them, and then the Fill property was changed as below to lookup the correct colour from the Collection:
ColorValue(
    LookUp(
        TemplateColours,
        ColourNumber = LookUp(
            CubeColours,
            FaceNumber = 1,
            Piece1
        ),
        ColourValue
   )
Resulting in coloured squares as below!

Adding the feature to turn the cube sides turned out to be one of the most difficult parts of this App. Once I’d drawn a sketch of the cube on paper it was a lot simpler:

This is the code to rotate the top side anti-clockwise. The code for the rest of the sides are slight variations on this.
// Store 1
Set(TempPiece1,LookUp( CubeColours, FaceNumber = 1, Piece1));
Set(TempPiece2,LookUp( CubeColours, FaceNumber = 1, Piece2));
Set(TempPiece3,LookUp( CubeColours, FaceNumber = 1, Piece3));

// Patch 1 from 4
ClearCollect(TempCubeColours, First(Filter(CubeColours,FaceNumber=4)));
Patch(CubeColours,First(Filter(CubeColours,FaceNumber=1)),
    {Piece1:First(TempCubeColours).Piece1,
        Piece2:First(TempCubeColours).Piece2,
        Piece3:First(TempCubeColours).Piece3});

// Patch 4 from 6
ClearCollect(TempCubeColours, First(Filter(CubeColours,FaceNumber=6)));
Patch(CubeColours,First(Filter(CubeColours,FaceNumber=4)),
    {Piece1:First(TempCubeColours).Piece1,
        Piece2:First(TempCubeColours).Piece2,
        Piece3:First(TempCubeColours).Piece3});

// Patch 6 from 2
ClearCollect(TempCubeColours, First(Filter(CubeColours,FaceNumber=2)));
Patch(CubeColours,First(Filter(CubeColours,FaceNumber=6)),
    {Piece1:First(TempCubeColours).Piece1,
        Piece2:First(TempCubeColours).Piece2,
        Piece3:First(TempCubeColours).Piece3});

// Patch 2 from 1 (Stored)
Patch(CubeColours,First(Filter(CubeColours,FaceNumber=2)),
    {Piece1:TempPiece1,
        Piece2:TempPiece2,
        Piece3:TempPiece3});
So, finally there is a fully working Cube which can be used, although it needs a bit of work to make it 3D.
3D CUBE
Initially I thought this would take a lot of time. There are no polygons in standard controls in Power Apps so consideration was given to each piece being made of one or more SVGs. An SVG is a scalable vector image file. For further information see Wikipedia and Matthew Devaneys blog post.
After a bit of searching online I found the perfect answer – a ready made Rubiks Cube in SVG format where I could modify the piece colours using Power Apps code. This is how the original SVG looks:

From here it was quite straightforward to change the SVG string and replace any piece colours using Lookups on the collection. I’m no expert in SVG but was able to work out that each piece polygon is a separate section in the SVG file, and has a corresponding colour value in it – see below.

By changing a colour to yellow I could see where it was on the cube as Power Apps renders SVGs in real time. Then I would simply put the lookup for the piece in the SVG code section – as below in Power Apps:

FINAL STEPS
Once this was complete proper buttons to rotate the cube were created (using SVGs from Bootstrap Icons).
Also a view of the reverse of the cube was created. This was simply a copy of the SVG, using the same technique as above mapping each piece in the SVG to it’s corresponding piece on the reverse of the cube. It took a bit of thinking to view the cube in reverse, and I ended up using a Rubiks Cube box and writing the piece numbers on it.


THE FINISHED APP
Here is the completed app in action:
FUTURE ENHANCEMENTS
These are some possible enhancements I’ll likely work on in the next version:
1. Animating the faces as they move. Possibly using Blender to create a 3D cube (I have experience in 3D modelling and rendering – see my Stills and Videos). Exporting each frame to SVG, adding piece colours, and then displaying it in Power Apps. There is quite a lot of work involved with this, and I’m unsure how feasible it will be to do in real time in Power Apps.
2. Solving a cube from a scrambled state. It’s unclear how this would be done but will enjoy investigating it.
3. Using a physical cube connected to the app. There is a bluetooth cube available from here. (Thanks to Andrew Rimell for spotting this).
FINAL THOUGHTS
I’m very excited for the future of Power Apps – it really is limited only by your imagination. I hope you enjoyed reading this, and look forward to any comments.
Cover Photo by Jadson Thomas from Pexels
We made our 2nd trip to Gran Canaria this year, our first was back in 2012 when didn’t do much travelling.
This year I wanted to explore the island so hired a scooter for 1 day. I rented a Piaggio Beverly 300cc scooter from Motos Tivoli (a highly recommended company) which was ideal.
The roads and views in Gran Canaria are quite amazing. The route I planned avoided the East of the island as it is quite busy around that way.
Here’s a short highlight video I made of my ride – it’s in 4K. The full video is 4 hours in total..
Here are some photos I took around the island whilst we were there:


BACKGROUND
I’ve been riding motorcycles for about 5 years, and pretty much every ride have used Geo-Tracker to record the GPS co-ordinates of the route and create a KML file of the route (which I store in Google Drive). I was interested in finding new areas to explore so wanted to view all of the areas I’ve ridden, and highlight areas I’d missed.
Below is the map I had at the end of this process, which was created in Google Earth Pro (the Windows version – it’s free). Each line is coloured by the year the route was made.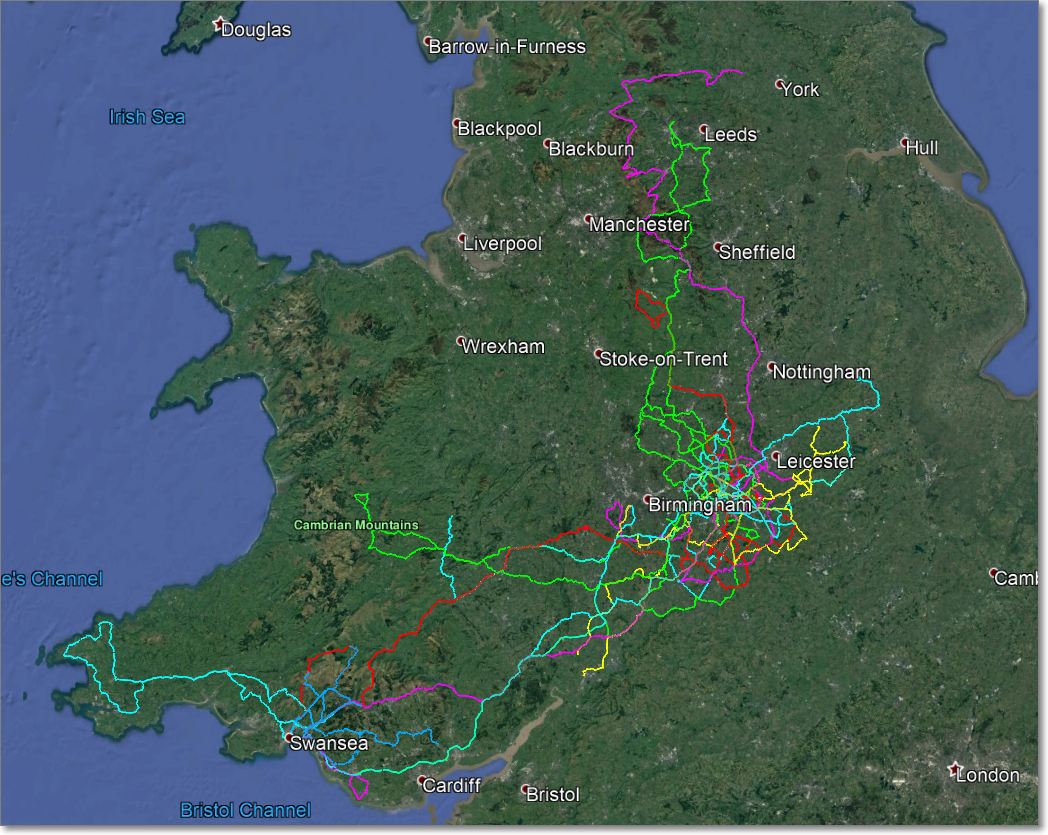
As you can see I live in the Midlands, near Coventry. Below is a close-up of that area, plus I’ve highlighted with yellow circles areas that I’ve not ridden: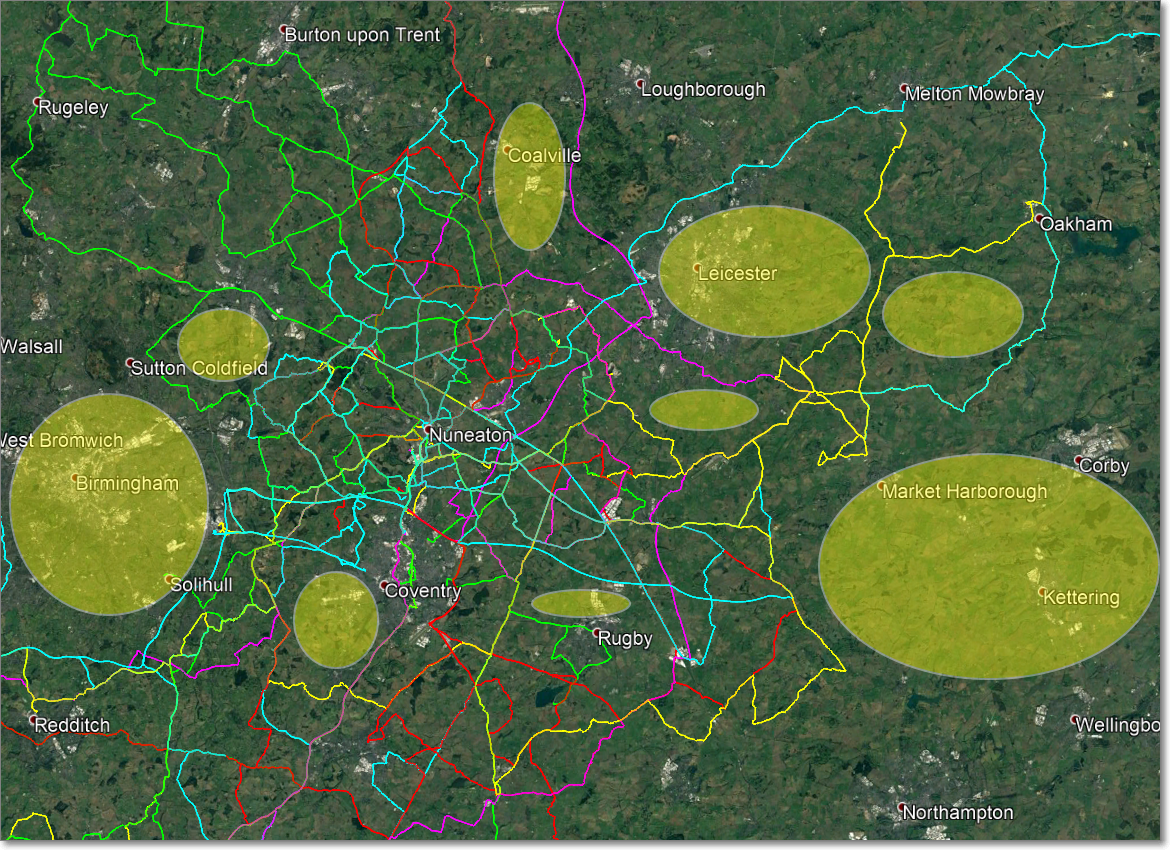
THE PROCESS
I found it easier to group all the KML’s I have by year and then put them into separate folders. You don’t need to do this and can use with a single folder of KML’s if you wish.
Convert multiple KML’s to KMZ
This simply packages multiple KML’s into a single KMZ file which makes the routes easier to handle in Google Earth.
Install and Start Google Earth Pro, and add a new Folder (either call it the year, or if not grouping by ear something like ‘ROUTES’):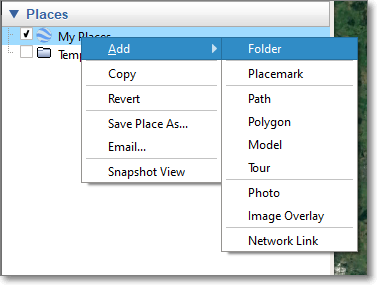

Then, select all of your KML files for that year and drag them exactly onto the new folder. You should now have something like: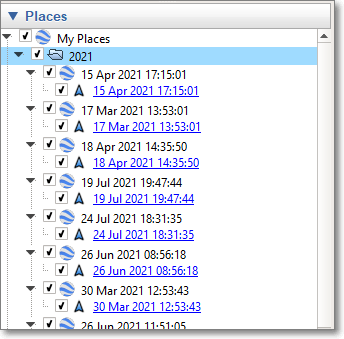
Right-click on the year and then ‘Save Place As’, then enter the file name and save. Then, right-click on the year again, click ‘Delete’ and click on OK.
Follow this process for all the years you want to process or just the one route if you prefer
Add all KMZ’s to Google Earth
Still in Google Earth Pro, there should be no folders, so create a new one. I call it ‘By Year’.
Then, drag all of the KMZ files (NOT the KMLs) onto this folder.
Then click on the right arrow symbol next to each sub folder to minimise it:
Double-clicking on the folder ‘By Year’ should show all your routes on the map, the next step is styling and colouring these.
Styling and Colouring
To change the widths of all lines, and remove the yellow pin (icons) right-click on ‘By Year’, then ‘Properties’. Click on the tab ‘Style Color’, then the button ‘Share Style’.
Change the highlighted values as below:
Click OK and OK.
For each year, right-click on it, then ‘Properties’. Click on the tab ‘Style Color’, then click on the Color to change it. Click OK and OK.
Final Steps
On the Layers section I turn them all off except for ‘Labels’ as it looks cleaner, but you can show ‘Places’ or ‘Roads’ if you prefer:
For easier viewing in Google Earth Pro I prefer the top-down view, the keyboard shortcut for this is ‘u’. Here are other Google Earth Pro keyboard shortcuts.
Closing Thoughts
I store and add new areas to explore in a Google My Maps, and for route planning, and navigation I use Google Maps on my phone with one headphone plugged in.
Photo by José Martín Ramírez Carrasco on Unsplash
Summary
As my background is in SQL Server databases I find it a lot easier to query data in SQL. The process in this post will show you how to carry out a manually run download of data from multiple objects in Salesforce or Dynamics CRM – using trial versions of KingswaySoft Tools in SSIS (SQL Server Integration Services).
I’ll be connecting to a trial Salesforce instance and downloading Contacts to SQL Server. Whenever I say Salesforce it can be interchanged with Dynamics CRM – the KingswaySoft CRM Components only slightly differ in how the objects and fields are selected.
I’ll assume that you have no prior knowledge of Visual Studio or SSIS, although you will need know how to connect to and run queries against a SQL database.
Requirements
You’ll need:
* A Salesforce or Dynamics CRM instance (this can be a trial)
* A Windows PC/Server with SSIS installed.
* A SQL Server instance (this can be hosted on a VM, or directly in Azure) with an empty database.
I’ll be using a VM running Windows 10 with the below items installed:
* SQL Server 2012 SP4
* Visual Studio 2015 Update 3
* SQL Server Data Tools for Visual Studio 2015
These are the versions I had had installed on my VM – newer versions of Visual Studio and SQL Server Data Tools should run fine, though I haven’t tested these.
Install KingswaySoft SSIS Integration Toolkit
We’ll install a trial version of this to allow us to connect to Salesforce. The only limitation that the trial version has is that you can only run it in the development environment. This means that the solution will not work if we deploy the SSIS package to a server – this will require a license.
Download links
SSIS Integration Toolkit for Salesforce –
https://www.kingswaysoft.com/products/ssis-integration-toolkit-for-salesforce/download
SSIS Integration Toolkit for Microsoft Dynamics 365 –
https://www.kingswaysoft.com/products/ssis-integration-toolkit-for-microsoft-dynamics-365/download
On the download form KingswaySoft requires a corporate/business email. 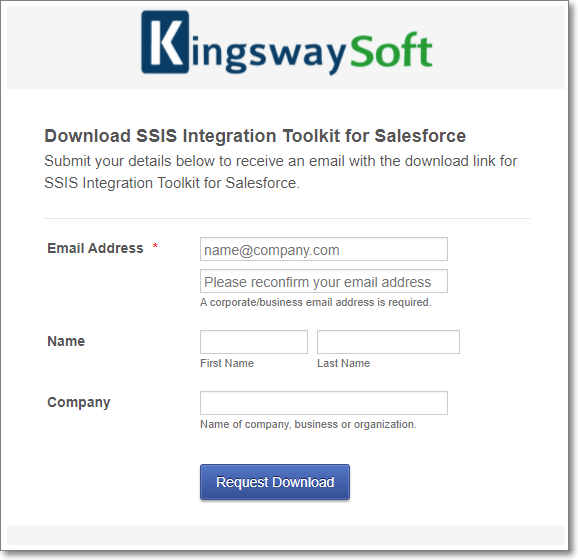
If you haven’t got such an email you can use a temporary email from https://10minutemail.com/
Installation
Once you have the installation files just install the toolkit taking the default options.
Create A Visual Studio Project
In Visual Studio create a new project of type ‘Integration Service Project’
If this options isn’t available ensure that SSIS and SQL Server Data Tools are installed correctly.
Add and Configure Connection Managers
We will make two connections here – one to Salesforce, and the second to SQL Server.
Connection to Salesforce
Right-click on the “Connection Managers” area on the bottom of the screen and select “New Connection…”
In the next dialog select the “Connection Manager for Salesforce” then click “Add”
You will now need to choose the Instance Type, and enter your (Salesforce) User Name & Password, and Security Token.
The Security Token is used to ensure that if someone has your Salesforce account details they can’t connect to the Salesforce data connector without it.
If you know your Security Token then enter it, otherwise request a new Token. This is the Salesforce Help Page for Security Tokens – https://help.salesforce.com/articleView?id=sf.user_security_token.htm&type=5
Click on “Test Connection” and you should see a message stating that the Test Connection Succeeded. If not, check the details you have entered.
Connection to SQL Server
Right-click on the “Connection Managers” area on the bottom of the screen and select “New OLE DB Connection…”
On the next dialog click “New” to make a new data connection, then enter the details for your SQL Server connection.
My connection is shown below, connecting to the local SQL Server (this is the dot in the Server Name) using SQL Server authentication and a database called “SFDB-Blog”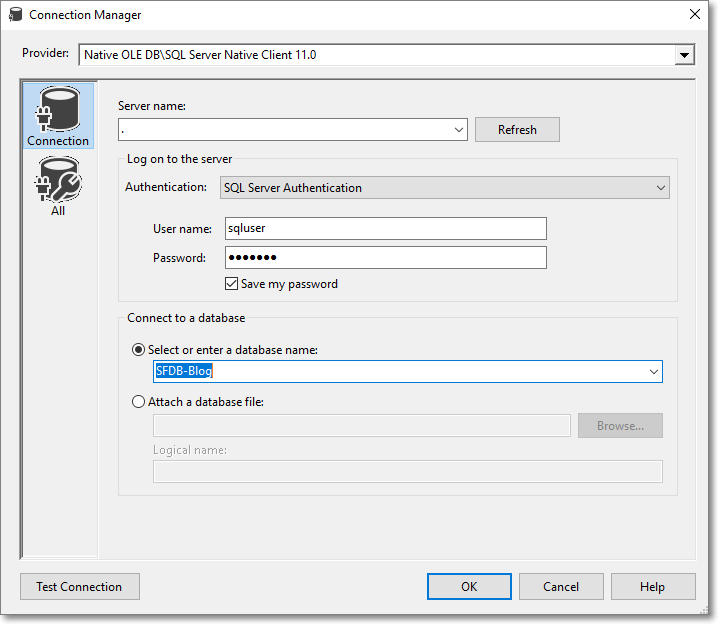 Click on “Test Connection” and you should see a message stating that the Test Connection Succeeded. If not, check the details you have entered.
Click on “OK” to close the Connection Manager dialog
You should now have 2 connections in the “Connection Managers”. Don’t worry about what they’re named – that’s not important.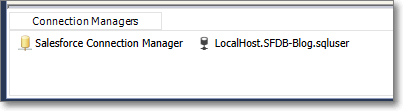
CREATING THE SALESFORCE SOURCE COMPONENT
From the SSIS Toolbox drag a “Data Flow Task” to the package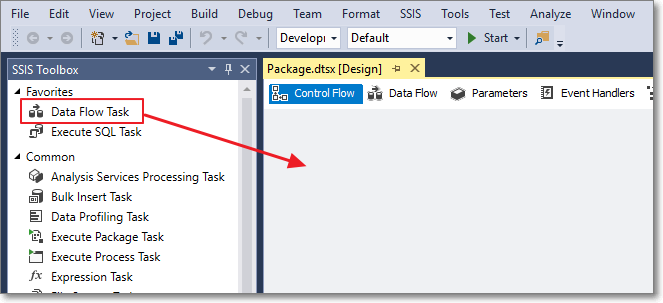
Right-click on the Data Flow Task and rename it to “DFT – Download Contacts”
Double-click on “DFT – Download Contacts” to edit it. You will now be in the Data Flow edit screen:
From the SSIS Toolbox drag a “Salesforce Source” component to the Data Flow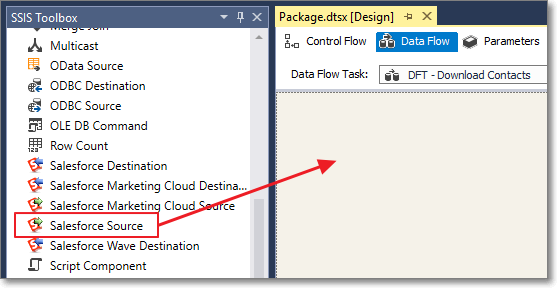
Double-click the newly added “Salesforce Source”. Click on the Connection Manager dropdown and select the value Salesforce Connection Manager.
For the Source Object select the object you want to download. I will be downloading the Contact object.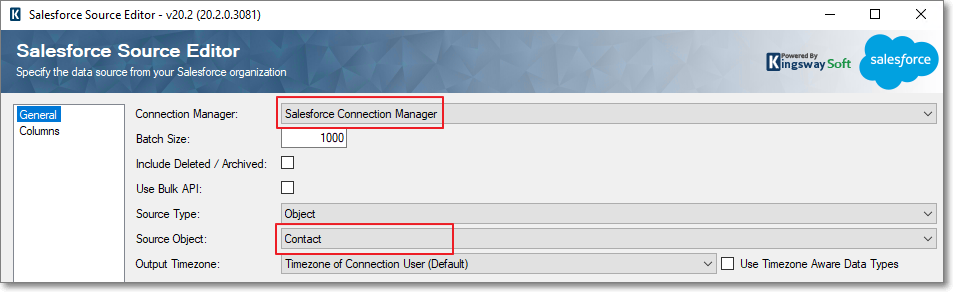
Click on the “Columns” on the left and select the fields you want to download. As a general rule of thumb it’s better to download only the fields you want – but always download the Id column (the record unique identifier). You may want to click on the top check box to uncheck all fields initially.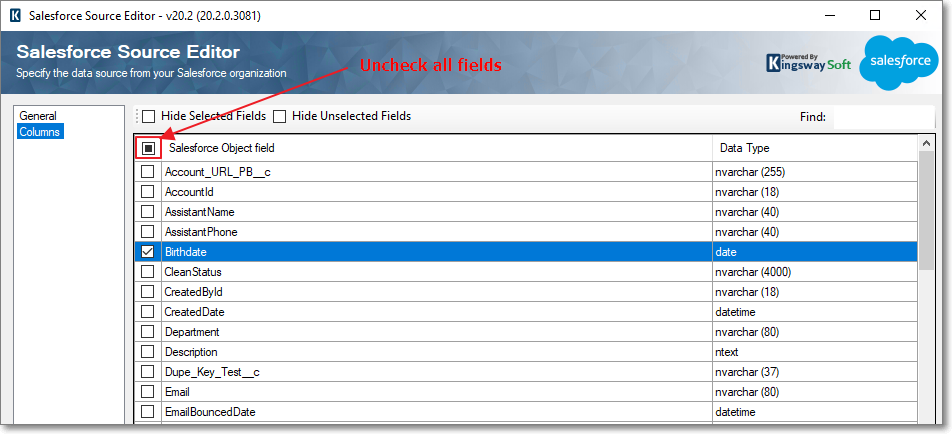
Click the ‘OK’ button to close the dialog
CREATING THE SQL DESTINATION COMPONENT
From the SSIS Toolbox drag a “OLE DB Destination” component to the Data Flow. Rename the newly added “OLE DB Destination” to “OLEDB – Contacts”.
Click on “Salesforce Source” component, and then drag the connector arrow to the “OLEDB – Contacts” component. It should now look as below:
Double-click “OLEDB – Contacts” to open the edit dialog.
We will now use the component to generate the SQL to create the SQL Server table to hold the data. Click the “New button” and the SQL will be displayed: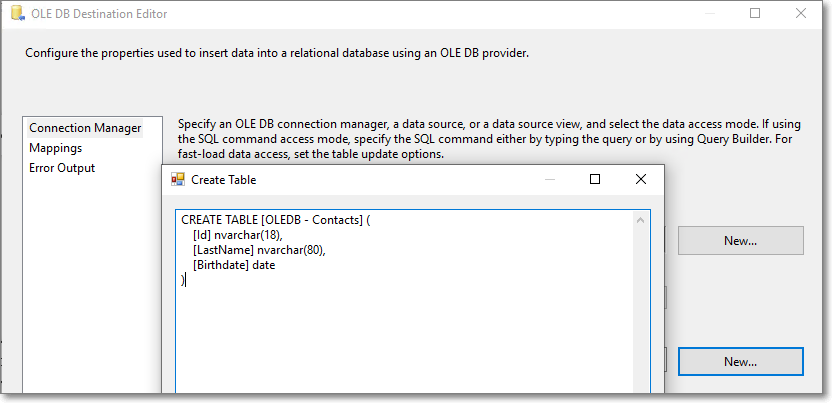
Copy this SQL and paste it into a connection to your SQL Server – I’m using SSMS (SQL Server Management Studio). In the script change the text “OLEDB – Contacts” to the name you want to give to the SQL table – I’ll be using “Contacts”. Execute the query to create the SQL table.
Back in Visual Studio – Cancel the open script dialog, and in the main dialog on the table dropdown select your new table.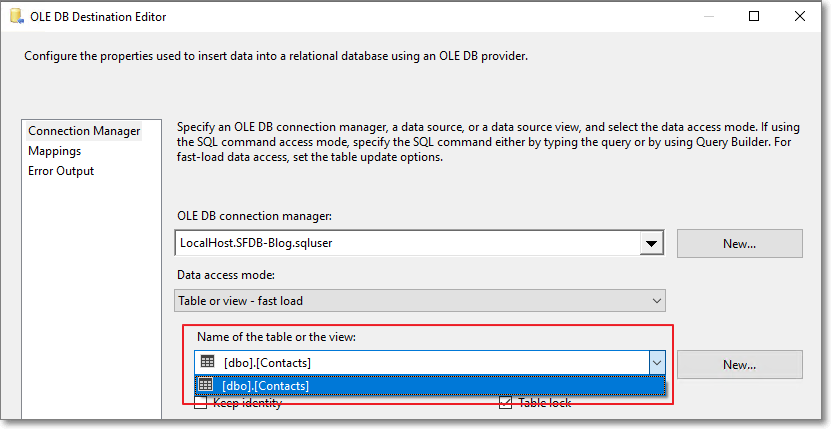
Click on the ‘Mappings” on the left to ensure that all columns are mapped correctly – it should look similar to below where all columns are connected from left to right:
Click “OK” to close the dialog.
FIRST RUN OF DOWNLOADING DATA
We are now ready to run and test the first table downloading data from Salesforce.
Click the “Start” button 
After a few seconds (or minutes depending on the number of records in your Salesforce data object) it should complete successfully:
To ensure it has worked correctly view the data in your SQL table: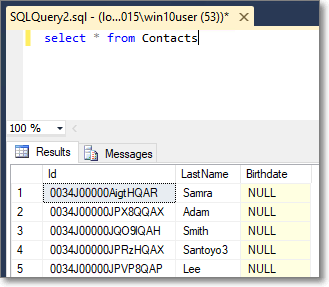
CLEAR DATA BEFORE RUN
When the routine runs we want to clear the existing SQL data otherwise it would append duplicate data to the SQL table.
To do this click on the “Control Flow”, and drag an “Execute SQL Task” component to the main pane, above the component “DFT – Download Contacts”:
Right-click on the newly added “Execute SQL Task” and rename it to “SQL – Truncate Contacts”
Double-click on ” SQL – Truncate Contacts” to edit it. For the “Connection” select the SQL connection, and in the “SQLStatement” enter as below (using your SQL table name):
Click OK to close the dialog, and as then connect the components by dragging the arrow from “Execute SQL Task” to “DFT – Download Contacts”
Click on the “Start” button to run the routine and once complete it should look as below.
ADDING MORE DOWNLOAD TABLES
You can repeat the above process to add additional tables. I’ve added the Account table – as shown below:
WRAP UP
I hope you found this post beneficial – Thanks for reading 🙂
Photo by Markus Spiske on Unsplash
The ForAll command is very handy if you want to loop around a collection and perform some calculations. One limiting feature is that you can’t use variables in the ForAll loop, using UpdateContext or Set.
There is a workaround, which is to create and use a single record collection to hold the values which can then be used as variables. The downside is that it does make the “code” not as straightforward to read.
This is the process I use:
Add a line to the Form OnVisible to reset the collection (unless you’re using the variable like a Global in which case put it in the App OnStart).
ClearCollect(colVariables, {colvarVariableOne:""});To read the variable value use
First(colVariables).colvarVariableOneTo set the variable value use:
Patch(colVariables, First(colVariables), {colvarVariableOne:"NEW VALUE"});One thing that can catch you out is that collection column types are set when the collection is initiated so set the default value to be of that type. For example to create a datetime column use:
ClearCollect(colVariables, {colvarHoliday:DateTimeValue("01/01/2000 00:00"});Photo by Tine Ivanič on Unsplash
For any mobile app these days it’s normally a requirement to be able to take photos for reference, and the new App I’m working on is no different.
Adding a photo facility to an App is very straightforward – put a Camera control onto a screen and add code in the OnSelect to take the Photo and add it a collection using Patch. Here’s my code to do this:
Patch(colPhotos, Defaults(colPhotos), {Value:Camera1_1.Photo, PhotoDateTime:Now()});
Of course most devices have multiple cameras these days – at minimum one front facing, and one rear facing. PowerApps allows you to change the camera in use by setting the Camera property of the Camera control (!) with a number.
These are the devices I have, and their associated Camera numbers
Samsung Galaxy S7
0 = Rear Camera, 1 = Front Camera, 2 = Not Available
IPhone 7
0 = Rear Camera, 1 = Front Camera, 2 = Front Camera
Samsung Galaxy S9
0 = Front Camera, 1 = Front Camera (Zoomed in), 2 = Rear Camera
NOTE: All the devices I’ve tested only have two cameras, 1 front and 1 rear – though there are many newer devices which have several rear cameras. I’m guessing that they would have Camera numbers from 2 onwards though I can’t verify this.
So it appears that the rear camera, which the user would most likely use, is not always 0. To allow the user to change camera I use a variable and store this to local cache so the App will start on the same camera the user was last on.
Code wise – the Camera control’s Camera property is set to varCameraNumber. There is a ‘Switch Camera’ button which loops around Cameras 0 to 2 using the code:
If(varCameraNumber=2,
UpdateContext({varCameraNumber:0});,
UpdateContext({varCameraNumber:varCameraNumber+1});
);
This is the code in the Screen OnVisible section. It uses LoadData with the 3rd parameter IgnoreNonexistentFile set to True. This is for when the App is first run and the file doesn’t exist.
LoadData(colCameraNumber, “colCameraNumber” ,true);
If(CountRows(colCameraNumber) = 0,
UpdateContext({varCameraNumber:0});,
UpdateContext({varCameraNumber:First(colCameraNumber).CameraNumber});
);
The last bit of code is at the end of the OnSelect of the ‘Switch Camera’ button.
ClearCollect(colCameraNumber,{CameraNumber:varCameraNumber});
SaveData(colCameraNumber,”colCameraNumber”);
That’s it, a fully functioning Camera control allowing switching of the viewing camera, which is saved per session too. 🙂
I’m quite new to the world of designing and developing Power Apps and came across an interesting puzzle during the creation of my first App. I can’t go into specifics about what the App is used for, suffice to say that there are parent records created on the server and the App is used to create multiple child records linked to the parent record. The App also has a requirement to be able to function when the device is offline (i.e. no mobile data available).
In the scenario where the users device is offline, the user will call the office and be told the ID of the parent record they are working with. The ID field is just an incremental counter on the backend and the user would enter this onto their device. To ensure that they are working with the correct parent record and also to bypass user typing errors, I thought it would be a good idea to add a check digit to this number.
I initially posted onto a PowerApps forum to see if someone had designed code for this method previously. There were no replies so I went about writing the code myself.
Firstly, there was the matter of choosing an algorithm that would generate the check digit. The Luhn Algorithm seemed to fit the requirements – it wasn’t overly complex and is used on credit card numbers so must be accurate. I used a variant of the algorithm using modulus 10.
These are the steps for the calculation (taken from this website).
Summary: Given an identifier, let’s say “139”, you travel right to left. Every other digit is doubled and the other digits are taken unchanged. All resulting digits are summed and the check digit is the amount necessary to take this sum up to a number divisible by ten.
Detail:
1. Work right-to-left, using “139” and doubling every other digit.
9 x 2 = 18
3 = 3
1 x 2 = 2
2. Now sum all of the digits (note ’18’ is two digits, ‘1’ and ‘8’). So the answer is ‘1 + 8 + 3 + 2 = 14′ and the check digit is the amount needed to reach a number divisible by ten. For a sum of ’14’, the check digit is ‘6’ since ’20’ is the next number divisible by ten.
Below is a recording of the App being run using the test value of 139
The code took a fair bit of time to develop as PowerApps is not really designed to work with loops and arrays, hence the need for several collections. Below is the full code:
ClearCollect(colStringChars, Split(txtInputValue.Text, ""));

UpdateContext({varOddEvenOffset:If(Mod(CountRows(colStringChars),2)=1,1,0)});

ClearCollect(colStringSeq, {RecNum:0});
Clear(colStringSeq);
ForAll(
       colStringChars,
       Collect(
               colStringSeq,
               {
                 ValueToSum:If(Mod(CountRows(colStringSeq) + 1 + varOddEvenOffset,2)=1,Result,Result * 2)
               }
       )
);

UpdateContext({varStage1Total: Concat(colStringSeq, ValueToSum)});

Clear(colStage2Numbers);
Collect(colStage2Numbers, Split(varStage1Total, ""));

UpdateContext({varStage2Sum: Sum(colStage2Numbers, Result)});

UpdateContext({varFinalCheckDigit: If(Mod(varStage2Sum,10) = 0,0, 10 - Mod(varStage2Sum,10))});

UpdateContext({varFinalOutput: txtInputValue.Text & varFinalCheckDigit});
I’m sure the code could be optimised to have less lines but I wanted to keep it readable (for when I come back to it in 6 months times to see how it works 😄).
That’s it – I’d appreciate any comments about the method I used, or the actual code developed.
I’ll be blogging every few weeks in the future about any more trinkets of PowerApps information I come across. Thanks!
Header Photo by Markus Spiske on Unsplash


